. 2009 Jul 17;31(1):145-57.
doi: 10.1016/j.immuni.2009.06.015.

Cell-intrinsic transforming growth factor-beta signaling mediates virus-specific CD8+ T cell deletion and viral persistence in vivo

Affiliations

Cell-intrinsic transforming growth factor-beta signaling mediates virus-specific CD8+ T cell deletion and viral persistence in vivo

Roberto Tinoco et al. Immunity. .

Abstract

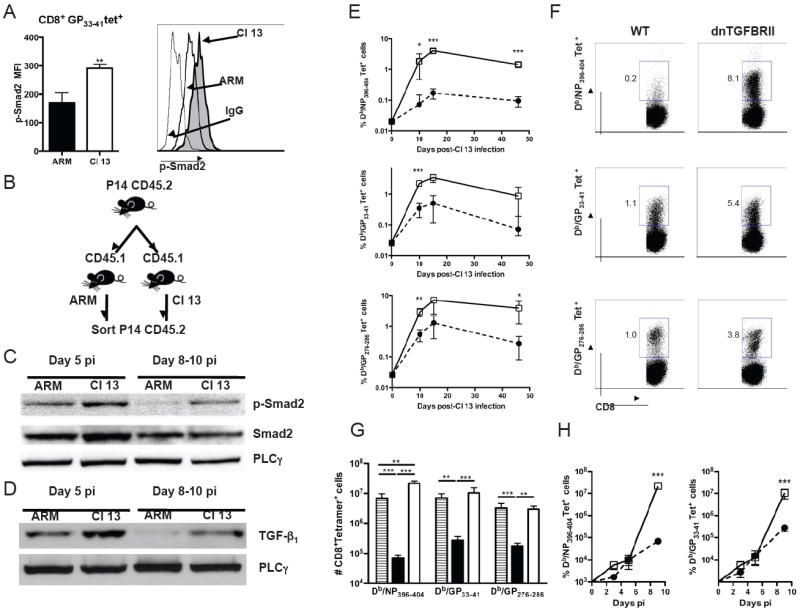
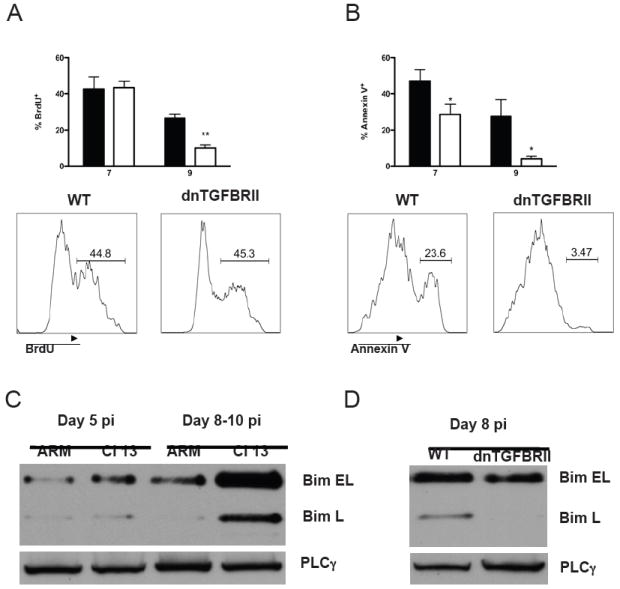
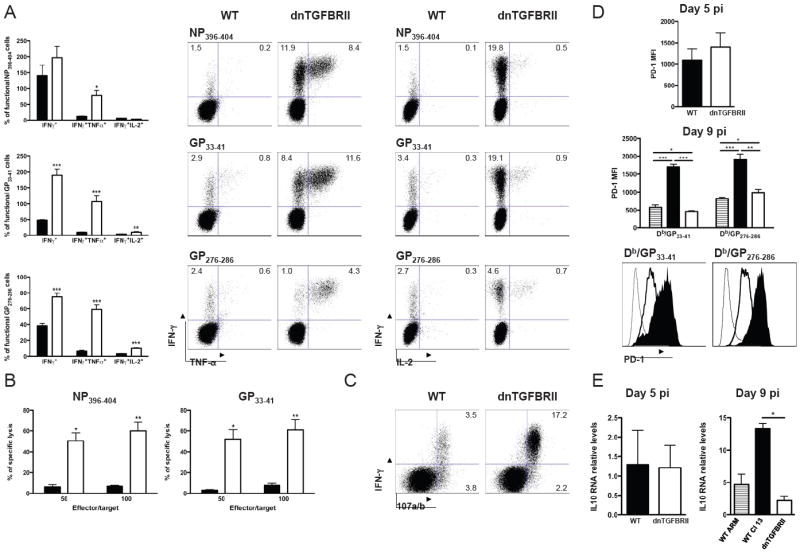
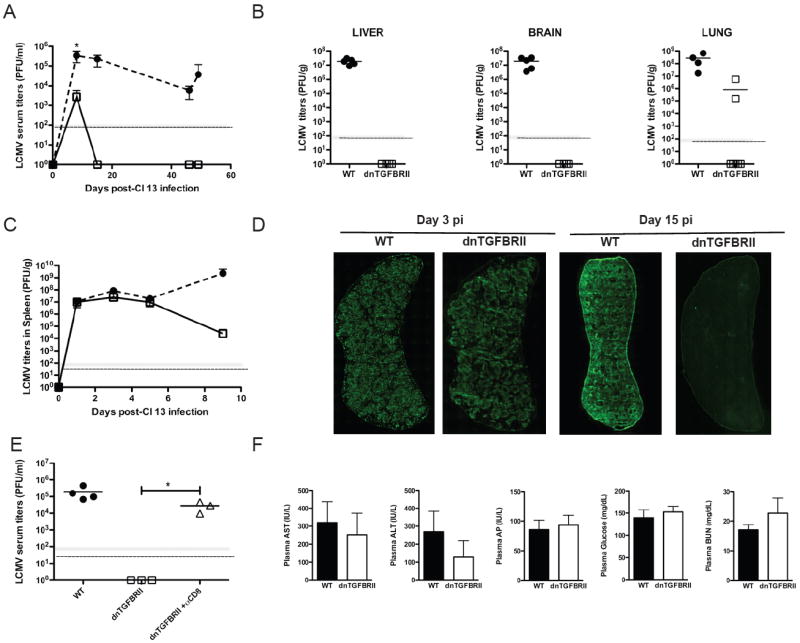
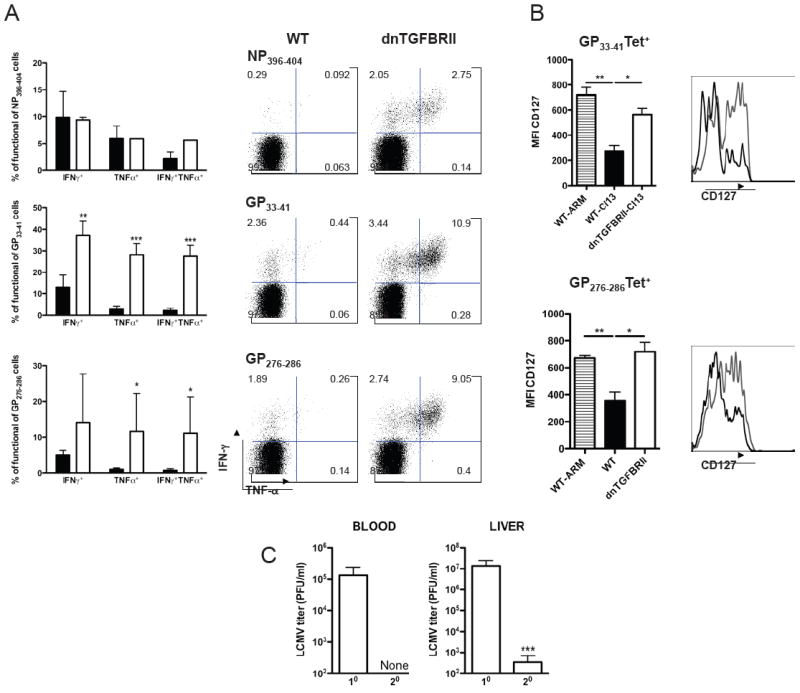
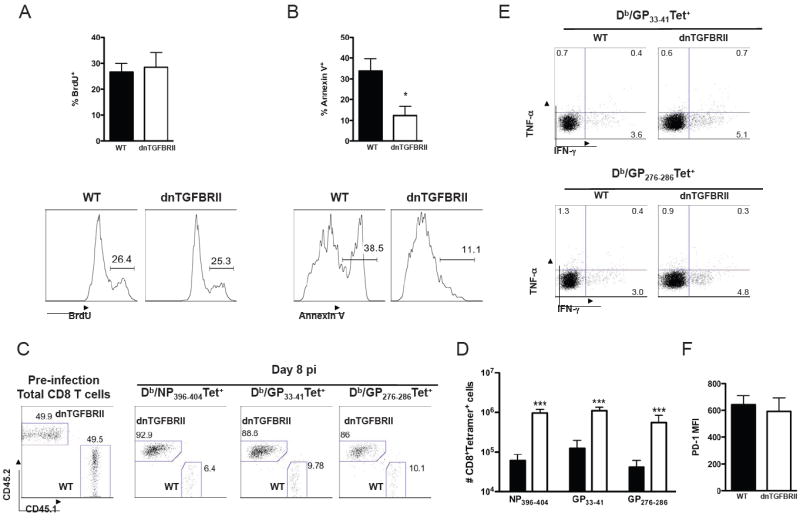
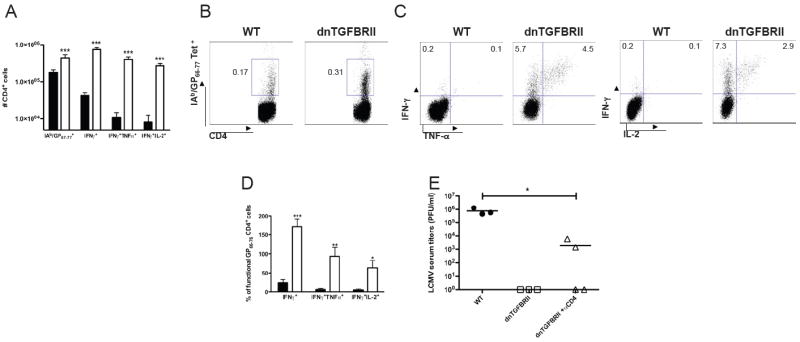
Although deficient CD8(+) T cell responses have long been associated with chronic viral infections, the underlying mechanisms are still unclear. Here we report that sustained transforming growth factor-beta (TGF-beta) expression and phosphorylation of its signaling mediator, Smad-2, were distinctive features of virus-specific CD8(+) T cells during chronic versus acute viral infections in vivo. The result was TGF-beta-dependent apoptosis of virus-specific CD8(+) T cells that related to upregulation of the proapoptotic protein Bim during chronic infection. Moreover, selective attenuation of TGF-beta signaling in T cells increased the numbers and multiple functions of antiviral CD8(+) T cells and enabled rapid eradication of the persistence-prone virus and memory generation. Finally, we found that cell-intrinsic TGF-beta signaling was responsible for virus-specific-CD8(+) T cell apoptosis and decreased numbers but was not necessary for their functional exhaustion. Our findings reveal persisting TGF-beta-Smad signaling as a hallmark and key regulator of CD8(+) T cell responses during chronic viral infections in vivo.


Figures

Figure 1
Figure 1. TGF-β/Smad signaling and accumulation of virus-specific CD8 T cells during LCMV infection
A) WT mice were infected with LCMV ARM or Cl 13, splenocytes were isolated at day 10 pi and stained with anti-CD8, Db/GP33-41 tetramers and anti-p-Smad-2/3 mAb. p-Smad-2/3 levels in Db/GP33-41 tetramer+CD8+ T cells were determined by FACS. Bar graphs indicate the average mean fluorescence intensity (MFI) ± standard deviation (sd) of 4 mice per group. Histograms depict one representative mouse per group. Thin line, Isotype control. B-D) Donor CD45.2+ P14 TCR transgenic CD8+ T cells were transferred into WT CD45.1+ recipients, hosts were infected with LCMV ARM or Cl 13, and pooled P14 cells FACS-purified at day 5 or 8-10 pi and processed for immunoblot blot. B) Sketch of experimental design. c) Levels of p-Smad-2, total Smad-2 in P14 cells. D) Levels of TGF-β1 in P14 cells. Phospholipase-γ (PLC-γ) was used as loading control. E-H) WT (black circles or bars) or dnTGFBRII (white squares or bars) mice were infected with LCMV Cl 13. WT-ARM infected mice were processed as controls (striped bars). Virus-specific CD8+ T cells from blood (E) or spleen (F-H) were stained with H2Db/NP396-404, Db/GP33-41 and/or Db/GP276-286 tetramers. E) Log-scaled plots showing average frequencies ± sd of tetramer+CD8+ blood cells at the indicated times pi. F) Dot plots displaying tetramer staining profiles in splenocytes from a representative mouse per group at day 9 pi. Numbers indicate % tetramer+CD8+ cells in the respective gate. G-H) Total numbers of tetramer+CD8+ cells per spleen at day 9 (G) or days 1 through 9 (H) pi. Note that numbers of tetramer+ T cells were similar to background levels at day 1 and 3 pi. All results are representative of two or three independent experiments with three to four mice per group each. (LCMV ARM vs Cl 13 or WT vs dnTGFBRII as indicated, *p<0.05, **p<0.005 and ***p<0.0005)
Figure 2
Figure 2. dnTGFBRII mice show increased survival and reduced levels of Bim in virus-specific CD8 T cells
A-B) WT (black bars) or dnTGFBRII (white bars) mice were infected with LCMV Cl 13. Spleen cells were isolated at day 7 and 9 pi and BrdU incorporation (A) and Annexin V staining (B) of H2Db GP33-41 tetramer+CD8+ T cells were determined. Histograms display a representative mouse per group and numbers indicate the frequency of cells within regions. C-D) Virus-specific CD8 T cells were FACS-isolated from WT mice infected with LCMV ARM or Cl 13 (C) or dnTGFBRII mice infected with Cl 13 (D) at days 8-10 pi. Cells were processed by immunoblot and the levels of Bim EL and Bim L isoforms are shown. Phospholipase-γ (PLC-γ) was used as loading control. Results are representative of 2-3 independent experiments with 3-5 mice per group (WT vs dnTGFBRII, *p<0.05 and **p<0.005)
Figure 3
Figure 3. Functional virus-specific CD8 T cells in LCMV Cl 13 infected dnTGFBRII mice
WT (black bars or histograms) or dnTGFBRII (white bars or histograms) mice were infected with LCMV Cl 13 and splenocytes obtained at day 9 pi unless otherwise stated. A) Cells were stimulated with NP396-404, GP33-41 and GP276-286 LCMV peptides and production of IFN-γ, TNF-α and IL-2 by CD8 T cells was analyzed. Bar graphs depict the average % ± sd of cytokine-producing CD8+ T cells normalized to the number of tetramer+ cells in the same spleen. Dot plots display a representative mouse for each peptide. Numbers indicate the % cells within the indicted gates. B) The cytotoxic capacity of virus-specific CD8 T cells was quantified by 51Cr release assay against targets cells loaded with LCMV peptides at the indicated ratios. The graphs show average % specific lysis ± sd. C) Cells were stimulated with GP33-41 peptide in the presence of FITC-labeled-anti-CD107a/b mAb. Dot plots represent one representative mouse per group D) PD-1 expression was quantified in Db/GP33-41+CD8+ and Db/GP276-286+CD8+ splenocytes. Bar graphs indicate the average PD-1 MFI ± sd. The histograms show representative data from one mouse per group. Shown are PD-1 expression on total CD8+ cells from uninfected controls (thin line) or on the indicated tetramer-positive dnTGFbRII (thick line) or WT (filled histogram) CD8 T cells from Cl 13 infected mice. E) IL-10 mRNA levels were quantified by real time RT-PCR and are shown as average ± sd normalized to GAPDH mRNA levels. WT-ARM infected mice at day 9 pi were processed as controls (striped bars). Results are representative of two or three independent experiments with three to four mice each. (WT vs dnTGFBRII, *p<0.05 and **p<0.005)
Figure 4
Figure 4. dnTGFBRII mice exhibit accelerated clearance of persistent LCMV
WT (black circles or bars) or dnTGFBRII (white squares or bars) mice were infected with LCMV Cl 13. A-C) Virus titers were determined by plaque assay in blood (A) and spleen (C) at the indicated time points and average LCMV titers ± sd are shown. B) The average viral titers in liver, brain and lung at day 15 pi are indicated by the lines and individual mice represented by each symbol. D) Spleen sections from WT or dnTGFBRII at day 3 or 15 pi were stained with anti-LCMV Ab. Panoramic spleen images are 10x magnification. E) dnTGFBRII mice were injected with depleting anti-CD8 mAb (white triangles) and virus titers in blood determined at day 12 pi. F) Plasma levels of the indicated molecules were determined at day 10 pi. Bar graphs show mean values ± sd. Results are representative of two or three independent experiments with three or five mice per group each. (WT vs dnTGFBRII or as indicated, *p<0.05)
Figure 5
Figure 5. Memory CD8 T cell response in Cl 13 infected dnTGFBRII mice
WT (black bars or histograms) or dnTGFBRII (white bars or grey histograms) mice were infected with LCMV Cl 13. A) Splenocytes were obtained at day 49 pi, stimulated with NP396-404, GP33-41 and/or GP276-286 LCMV peptides and production of IFN-γ and TNF-α by CD8 T cells was analyzed. Bar graphs depict average % ± sd of cytokine-producing CD8+ T cells normalized to the number of corresponding tetramer+ cells in the same spleen. Dot plots display one representative mouse per group; Numbers indicate the % of cells within the respective gate. B) CD127 expression was quantified in Db/GP33-41+CD8+ and Db/GP276-286+CD8+ blood cells after 2 months pi. Bar graphs indicate the average CD127 MFI ± sd. ARM infected mice were processed as controls (striped bars). Histograms depict one representative mouse per group. C) dnTGFBRII mice were re-challenged with LCMV Cl 13 (secondary, 20) and processed in parallel to primary-infected dnTGFBRII mice (10). Average viral titers in blood and liver at day 5 pi ± sd are depicted. Results are representative of two experiments with three to five mice per group. (WT vs dnTGFBRII or 10 vs 20, *p<0.05, **p<0.005 and ***p<0.0005)
Figure 6
Figure 6. Direct and indirect TGF-β effects on virus-specific CD8 T cells
A-B) P14-WT (black bars) and P14-dnTGFBRII (white bars) CD8+ T cells were co-transfered into WT mice 1 day before LCMV Cl 13 infection. BrdU incorporation (A) and Annexin V staining (B) of P14 cells were determined at day 8 pi. Bar graphs depict the average frequency of positive cells ± sd. Histograms display a representative mouse and numbers indicate the frequency of cells within regions. C-F) WT:dnTGFBRII mixed BM chimeras were processed to analyze CD45.1+ WT and CD45.2+ dnTGFBRII CD8 T cells before (pre-infection) and at day 8 after Cl 13 infection. C) Total CD8 T cells in blood before infection and within spleen Db/NP 396-404 and Db/GP33-41 tetramer+ cells at day 8 pi. D) Total numbers of tetramer+CD8+ cells per spleen at day 8 pi. E) Production of IFN-γ and TNF-α after GP33-41 and GP276-286 LCMV peptide-stimulation at day 8 pi. F) PD-1 expression within Db/GP33-41 tetramer+ cells at day 8 pi. Dot plots display a representative mouse and numbers indicate the frequency of cells within regions. Results are representative of two independent experiments with 4-8 mice per group.
Figure 7
Figure 7. dnTGFBRII mice mount a potent anti-viral CD4 T cell response
WT (black bars or black circles) or dnTGFBRII (white bars or white squares) mice were infected with LCMV Cl 13 and splenocytes obtained at day 9 pi. (A-D) Virus-specific CD4+ T cells were stained with IAb/GP66-77 tetramers or stimulated with GP66-77 LCMV peptide to analyze the production of IFN-γ TNF-α and IL-2. (A) Average number ± sd of total IAb/GP66-77+ or cytokine producing CD4+ cells per spleen. (B, C) Dot plots represent one representative mouse per group; Numbers denote the % cells within each gate. (D) Mean percentages ± sd of cytokine-producing CD4+ T cells normalized to the number of IAb/GP66-77 tetramer+ cells in the same spleen. E) dnTGFBRII mice were injected with depleting anti-CD4 mAb (white triangles) and virus titers in blood determined at day 12 pi. Data are representative of two or three independent experiments with three to four mice each. (WT vs dnTGFBRII, or dnTGFBRII-anti-CD4, *p<0.05, **p<0.005 and ***p<0.0005)

Similar articles

Cited by

References

    1. Ahmed R, Butler LD, Bhatti L. T4+ T helper cell function in vivo: differential requirement for induction of antiviral cytotoxic T-cell and antibody responses. J Virol. 1988;62:2102–2106. - PMC - PubMed
    1. Ahmed R, Salmi A, Butler LD, Chiller JM, Oldstone MB. Selection of genetic variants of lymphocytic choriomeningitis virus in spleens of persistently infected mice. Role in suppression of cytotoxic T lymphocyte response and viral persistence. J Exp Med. 1984;160:521–540. - PMC - PubMed
    1. Alatrakchi N, Graham CS, van der Vliet HJ, Sherman KE, Exley MA, Koziel MJ. Hepatitis C virus (HCV)-specific CD8+ cells produce transforming growth factor beta that can suppress HCV-specific T-cell responses. J Virol. 2007;81:5882–5892. - PMC - PubMed
    1. Annes JP, Munger JS, Rifkin DB. Making sense of latent TGFbeta activation. J Cell Sci. 2003;116:217–224. - PubMed
    1. Barber DL, Wherry EJ, Masopust D, Zhu B, Allison JP, Sharpe AH, Freeman GJ, Ahmed R. Restoring function in exhausted CD8 T cells during chronic viral infection. Nature. 2006;439:682–687. - PubMed

Publication types

MeSH terms