. 2009 Aug;46(2):114-21.
doi: 10.1016/j.ceca.2009.06.002. Epub 2009 Jul 14.

Pathways of abnormal stress-induced Ca2+ influx into dystrophic mdx cardiomyocytes

Affiliations

Pathways of abnormal stress-induced Ca2+ influx into dystrophic mdx cardiomyocytes

M Fanchaouy et al. Cell Calcium. 2009 Aug.

Abstract

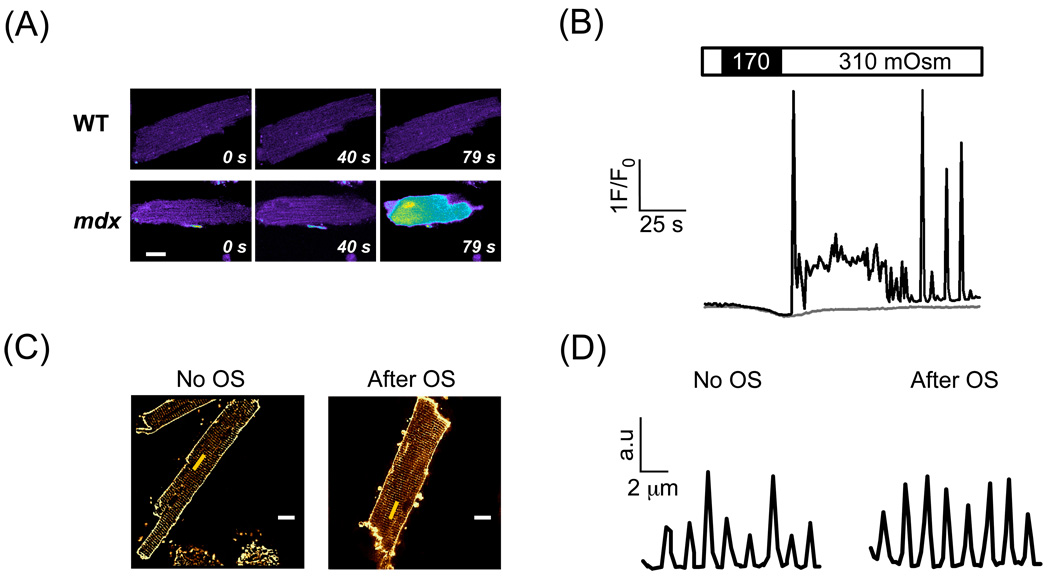
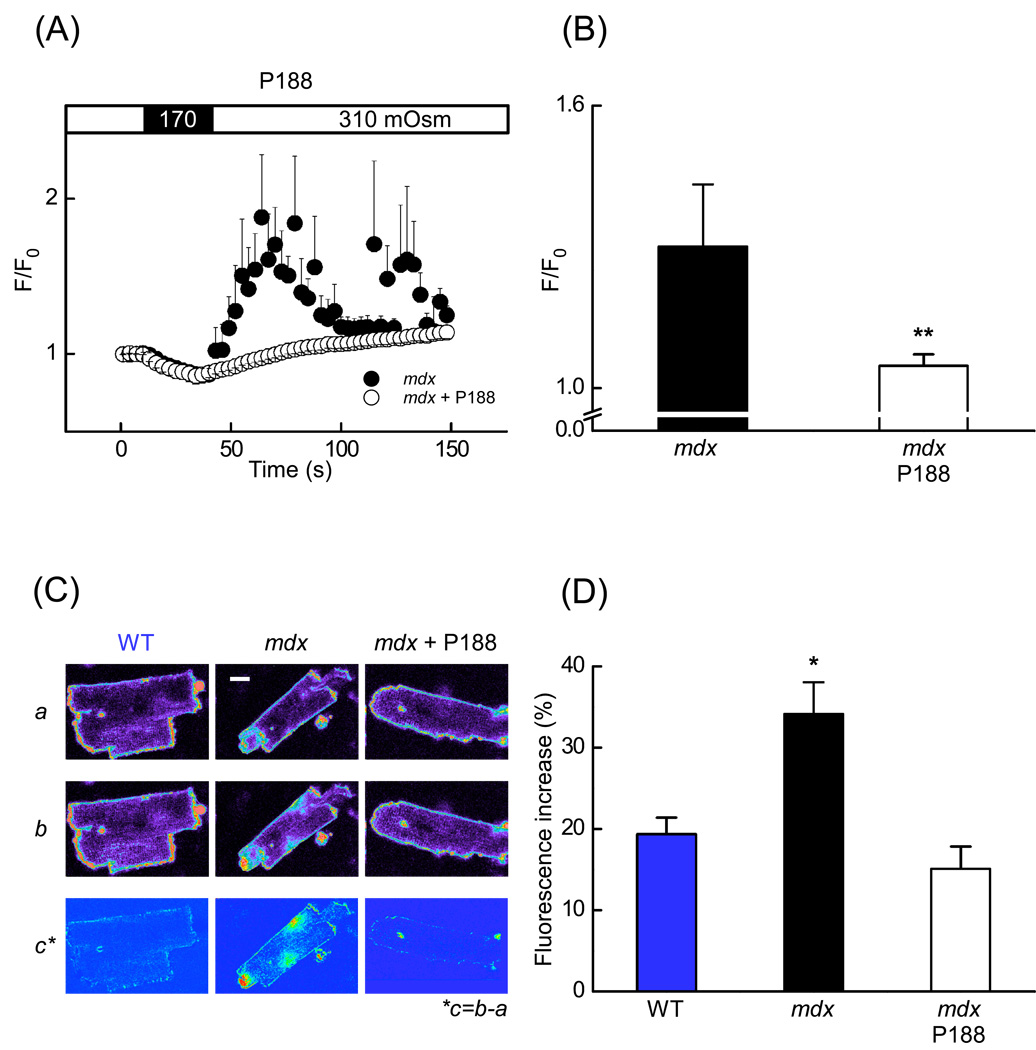
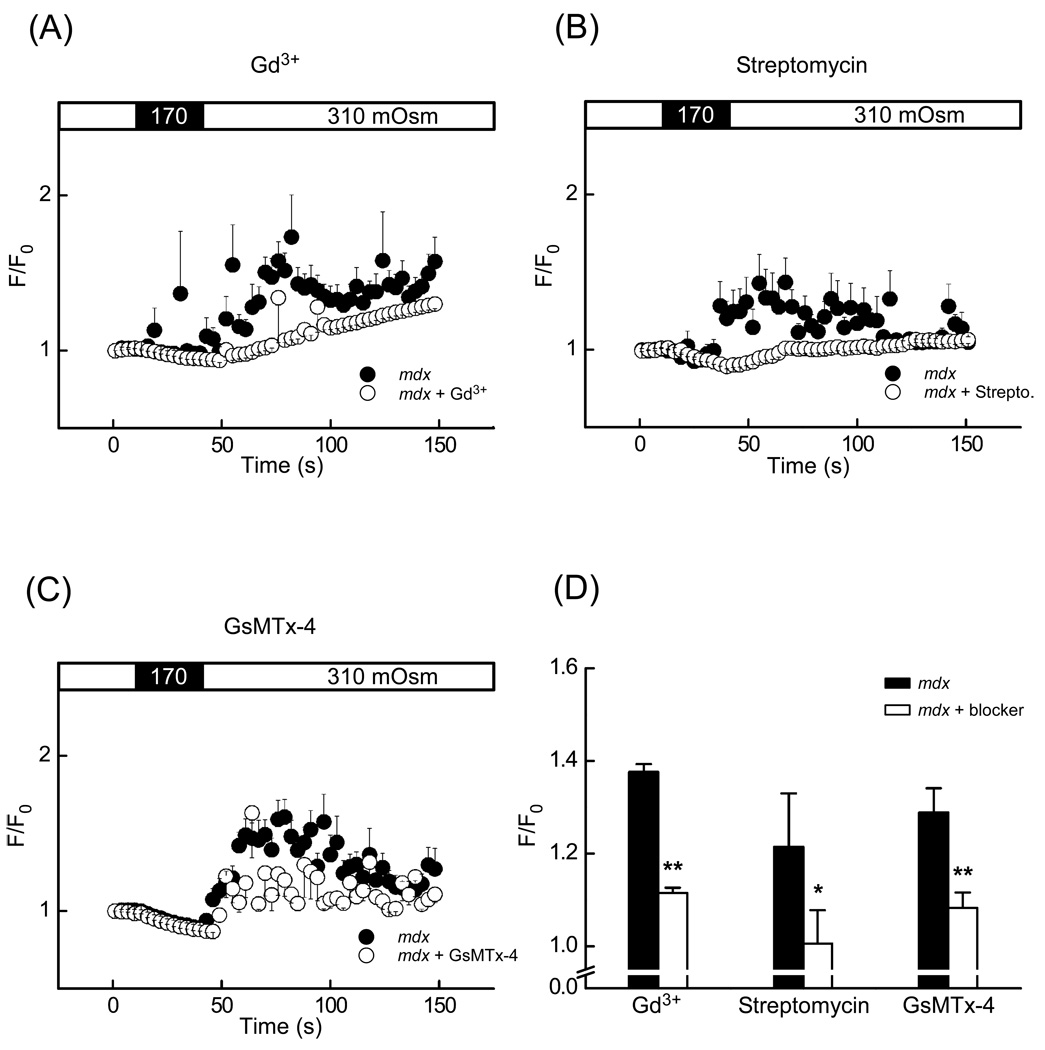
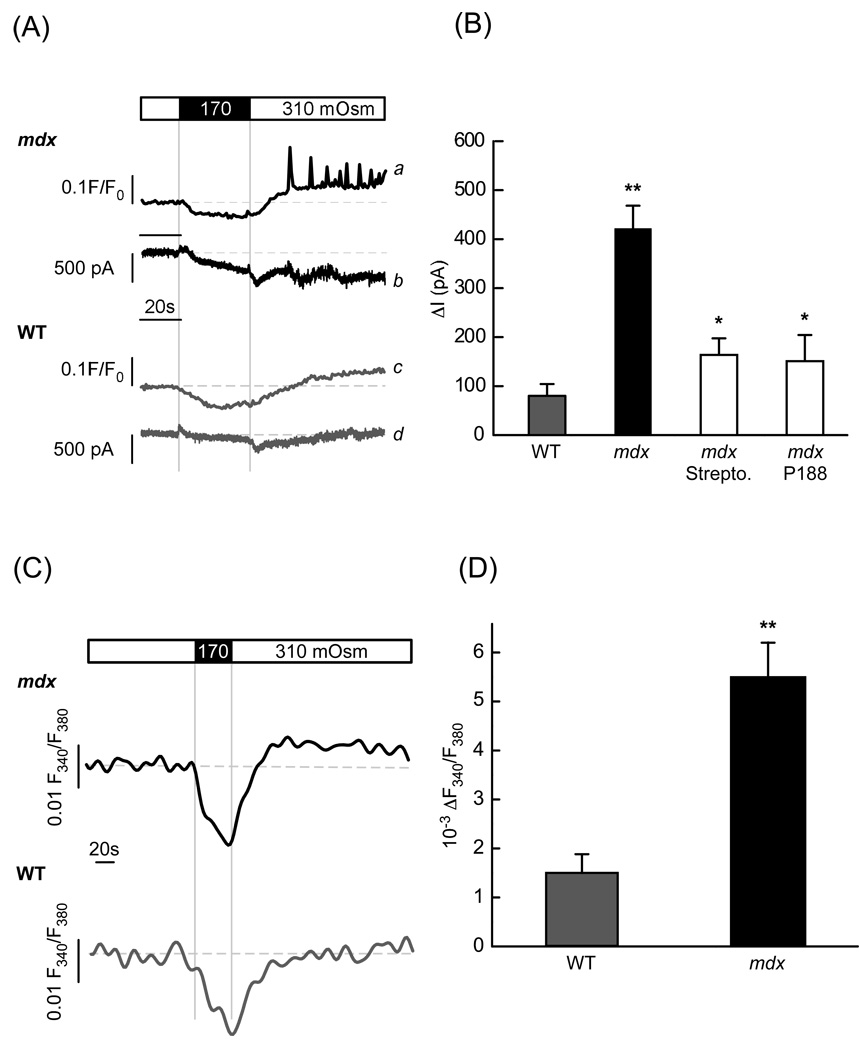
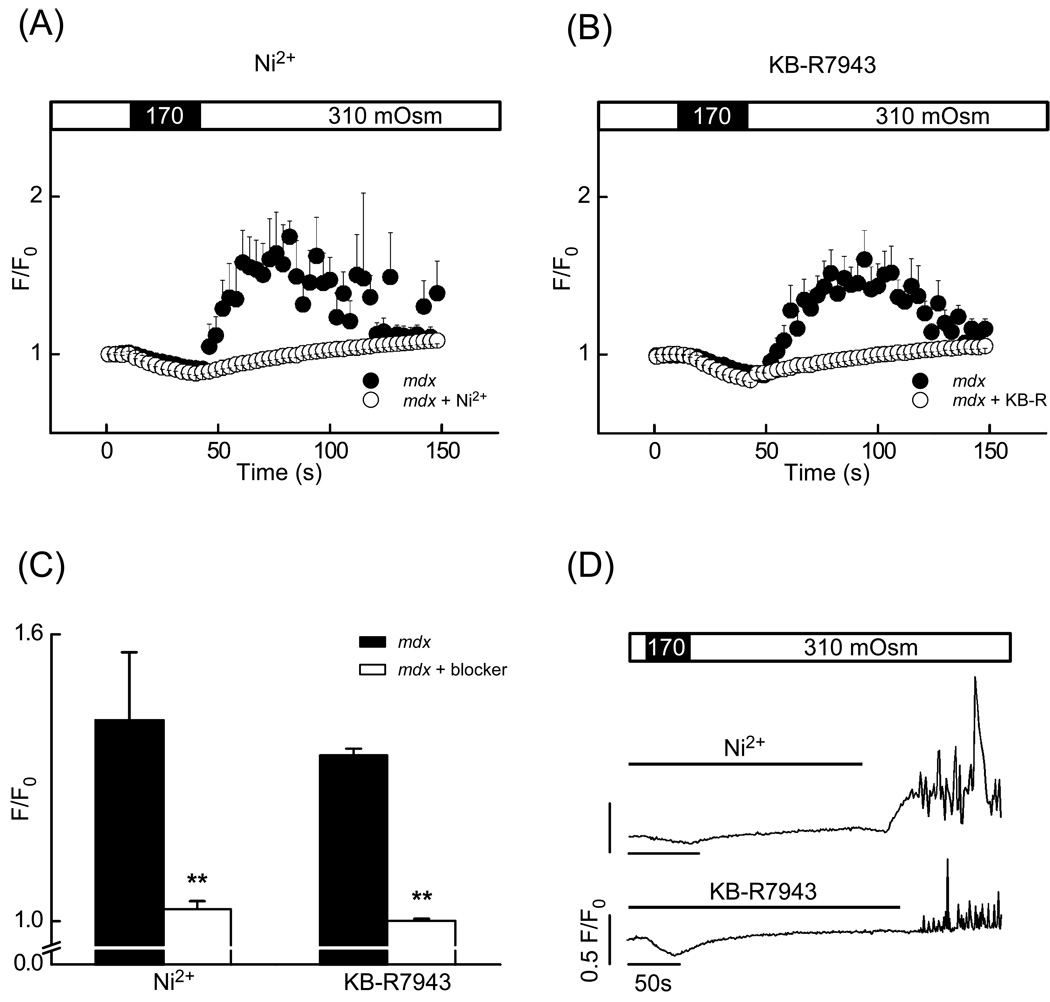
In Duchenne muscular dystrophy, deficiency of the cytoskeletal protein dystrophin leads to well-described defects in skeletal muscle, but also to dilated cardiomyopathy, accounting for about 20% of the mortality. Mechanisms leading to cardiomyocyte cell death and cardiomyopathy are not well understood. One hypothesis suggests that the lack of dystrophin leads to membrane instability during mechanical stress and to activation of Ca2+ entry pathways. Using cardiomyocytes isolated from dystrophic mdx mice we dissected the contribution of various putative Ca2+ influx pathways with pharmacological tools. Cytosolic Ca2+ and Na+ signals as well as uptake of membrane impermeant compounds were monitored with fluorescent indicators using confocal microscopy and photometry. Membrane stress was applied as moderate osmotic challenges while membrane current was quantified using the whole-cell patch-clamp technique. Our findings suggest a major contribution of two primary Ca2+ influx pathways, stretch-activated membrane channels and short-lived microruptures. Furthermore, we found evidence for a secondary Ca2+ influx pathway, the Na+-Ca2+ exchange (NCX), which in cardiac muscle has a large transport capacity. After stress it contributes to Ca2+ entry in exchange for Na+ which had previously entered via primary stress-induced pathways, representing a previously not recognized mechanism contributing to subsequent cellular damage. This complexity needs to be considered when targeting abnormal Ca2+ influx as a treatment option for dystrophy.


Figures

Fig. 1
Fig. 1
Stress-induced intracellular Ca2+ signals in mdx cardiac myocytes loaded with fluo-3. (A) Confocal fluorescence images of Ca2+ signals in response to an osmotic challenge in WT and mdx myocytes. (B) Exposure to low osmolarity stimulates SR Ca2+-release signals. Traces represent normalized fluorescence signals in an mdx (black trace) and WT cardiomyocyte (grey trace). (C) Cell membrane of WT myocytes was stained with 5 µM Di-8-ANEPPS either in control conditions or after recovery from osmotic stress (OS). White scale bars: 10 µm. The yellow line indicates the region for the profile in (D). Pattern of T-tubule fluorescence in control (left panel) and after stress (right panel). Sarcomere length was around 2 µm in both cells.
Fig. 2
Fig. 2
Poloxamer-188 (P-188) abolished stress-induced Ca2+ signals and prevented membrane microruptures in mdx cardiac myocytes. (A) Time-course of normalized fluorescence from fluo-3 in mdx myocytes (black circles) (n = 7 cells) and in mdx cells pretreated with 150 µM P-188 (white circles) (n = 7 cells). (B) Mean Ca2+ related fluorescence of cardiomyocytes recorded during 90 s after the osmotic challenge (from A) in control mdx (black bar) and mdx cells pretreated with P-188 (white bar). (C) Fluorescence images of cardiomyocytes continuously perfused with the lipophilic dye FM1-43 (2.4 µM) to detect transient membrane microruptures. The first images (Ca) were obtained before the stress. The second row of images (Cb) were captured 160 s after the osmotic challenge. Experiments were carried out with WT myocytes, mdx cells under control conditions and in the presence of 150 µM P-188. The bottom row of images (Cc) represents the difference (b – a). (D) Statistical analysis of the data as the fluorescence increase measured over the entire area of cardiomyocytes in WT, mdx and mdx cells pretreated with 150 µM P-188 (n = 18 cells for WT, n = 23 cells for mdx control, n = 13 cells for mdx with P188). Scale bars: 10 µm.
Fig. 3
Fig. 3
Stretch-activated channel inhibitors Gd3+, streptomycin and GsMTx-4 significantly decreased the amplitude of stress-induced intracellular Ca2+ signals in mdx cardiomyocytes loaded with fluo-3. (AC) Time-course of normalized fluorescence in mdx cells in control solution (black circle) and in mdx pretreated with an inhibitor (white circle). (A) Superfusion with 10 µM Gd3+, (B) with 100 µM streptomycin (C) with 5 µM GsMTx-4. (D) Mean fluorescence intensity 90 s after the application of stress in mdx cardiomyocytes (white bar) and mdx cardiomyocytes pretreated with an inhibitor (black bar) (number of cells was n = 11, 8, 19 for controls, n = 10, 14, 14 for Gd3+, streptomycin and GsMTx-4, respectively).
Fig. 4
Fig. 4
Stress-induced membrane currents and ion influxes. (A) Representative intracellular Ca2+ signals and ionic currents produced by stress in mdx (traces a and b) and WT (traces c and d) cardiac myocytes held at −70 mV. (B) Average increase of stress-induced inward currents in mdx and WT myocytes under control conditions (no inhibitors added) and in mdx cells treated with 100 µM streptomycin or 150 µM P-188 (n= 15, 18, 18, 11 for WT, mdx, P-188 and streptomycin, respectively). (C) Changes of intracellular Na+ concentration elicited by osmotic swelling in mdx and in WT myocytes. (D) Relative changes in [Na+]i in the WT and mdx cells determined at the end of the recording (between 110 s and 140 s after stress was applied, n=16 and 18, respectively).
Fig. 5
Fig. 5
Ni2+ and KB-R7943: NCX-blockers significantly decreased the stress-induced Ca2+ signal amplitude. (A) and (B) Time-courses of normalized fluorescence intensity in mdx cardiomyocytes (black circles) and in mdx cardiomyocytes pretreated with an NCX inhibitor (white circles). (A) Presence of 5 mM Ni2+ or (B) 20 µM KB-R7943 during the stress. (C) Mean normalized fluorescence intensity after the stress in mdx myocytes under control conditions (black bar) and in the presence of an inhibitor (white bar; number of cells was n=5 and 15 for controls, n=11, 15 for Ni2+ and KB-R7943, respectively). (D) Sample traces of normalized Ca2+ signals appearing after the washout of 5 mM Ni2+ or 20 µM KB-R7943 as indicated by line bars.

References

    1. Ervasti JM, Campbell KP. Dystrophin and the membrane skeleton. Curr Opin Cell Biol. 1993;5:82–87. - PubMed
    1. Finsterer J, Stollberger C. The heart in human dystrophinopathies. Cardiology. 2003;99:1–19. - PubMed
    1. Quinlan JG, Hahn HS, Wong BL, Lorenz JN, Wenisch AS, Levin LS. Evolution of the mdx mouse cardiomyopathy: physiological and morphological findings. Neuromuscul Disord. 2004;14:491–496. - PubMed
    1. Allen DG, Whitehead NP, Yeung EW. Mechanisms of stretch-induced muscle damage in normal and dystrophic muscle: role of ionic changes. J Physiol. 2005;567:723–735. - PMC - PubMed
    1. Jung C, Martins AS, Niggli E, Shirokova N. Dystrophic cardiomyopathy: amplification of cellular damage by Ca2+ signalling and reactive oxygen species-generating pathways. Cardiovasc Res. 2008;77:766–773. - PubMed

Publication types