. 2009 Sep 11;284(37):25412-20.
doi: 10.1074/jbc.M109.033175. Epub 2009 Jul 15.

Novel DNA binding properties of the Mcm10 protein from Saccharomyces cerevisiae

Affiliations

Novel DNA binding properties of the Mcm10 protein from Saccharomyces cerevisiae

Shlomo Eisenberg et al. J Biol Chem. .

Abstract

The Mcm10 protein is essential for chromosomal DNA replication in eukaryotic cells. We purified the Saccharomyces cerevisiae Mcm10 (ScMcm10) and characterized its DNA binding properties. Electrophoretic mobility shift assays and surface plasmon resonance analysis showed that ScMcm10 binds stably to both double strand (ds) DNA and single strand (ss) DNA. On short DNA templates of 25 or 50 bp, surface plasmon resonance analysis showed a approximately 1:1 stoichiometry of ScMcm10 to dsDNA. On longer dsDNA templates, however, multiple copies of ScMcm10 cooperated in the rapid assembly of a large, stable nucleoprotein complex. The amount of protein bound was directly proportional to the length of the DNA, with an average occupancy spacing of 21-24 bp. This tight spacing is consistent with a nucleoprotein structure in which ScMcm10 is aligned along the helical axis of the dsDNA. In contrast, the stoichiometry of ScMcm10 bound to ssDNA of 20-50 nucleotides was approximately 3:1 suggesting that interaction with ssDNA induces the assembly of a multisubunit ScMcm10 complex composed of at least three subunits. The tight packing of ScMcm10 on dsDNA and the assembly of a multisubunit complex on ssDNA suggests that, in addition to protein-DNA, protein-protein interactions may be involved in forming the nucleoprotein complex. We propose that these DNA binding properties have an important role in (i) initiation of DNA replication and (ii) formation and maintenance of a stable replication fork during the elongation phase of chromosomal DNA replication.


Figures
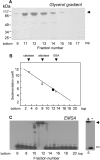
FIGURE 1.
FIGURE 1.
Purified GST-ScMcm10 binds to duplex DNA. The GST-Mcm10 protein was purified as described under “Experimental Procedures.” A, an aliquot (200 μl) of the S-Sepharose fraction was loaded onto a linear 20 to 40% glycerol gradient and analyzed by ultracentrifugation. After fractionating the gradient, aliquots (150 μl) of each fraction were analyzed by electrophoresis on SDS-PAGE (“Experimental Procedures”). Proteins were identified in fractions 9–17. The black arrow points to the GST-ScMcm10 protein. The numbers on the left represent the apparent molecular mass of pre-stained protein markers (Fermentas); β-galactosidase (117 kDa), BSA (85 kDa), ovalbumin (49 kDa), carbonic anhydrase (34 kDa), and β-lactoglobulin (25 kDa). B, a solution (200 μl) containing protein standards, BSA (67 kDa), aldolase (154 kDa), and catalase (232 kDa) (50–100 μg of each) were loaded onto an identical and parallel glycerol gradient. Sedimentation and subsequent analysis of the gradient were as in A. Symbols (open square, triangle, and open circle) represent the peak fraction of protein standards: catalase (11.3 S), aldolase (7.35 S), and BSA (4.3 S), respectively. The black-filled circle represents the peak fraction of GST-ScMcm10. Sedimentation coefficient values are from Refs. and . C, autoradiogram of an agarose gel after a DNA binding assay. Aliquots (5 μl) were withdrawn from the glycerol gradient fractions (A) and used in a DNA binding assay as described under “Experimental Procedures”. Lane S, + represents a DNA binding assay of an aliquot (2 μl) withdrawn from the S-Sepharose fraction, which was loaded onto the gradient in A. Lane (-) represents a reaction incubated in absence of GST-ScMcm10. The arrows (black and white) point to the GST-ScMcm10-DNA complex and free DNA, respectively.
FIGURE 2.
FIGURE 2.
ScMcm10 binding to dsDNA analyzed by DNA competition experiments and by SPR. A, DNA binding reactions were performed as described under “Experimental Procedures.” The DNA substrate used was 32P-labeled ARS1501-300. To test DNA binding specificity, increasing amounts of competing DNA were added to the reaction mixtures prior to incubation and their loading on agarose gels. Competing DNA used was plasmid pARS1501 harboring ARS1501 DNA and øX174 RFI and RFII. B–E represent real-time kinetic analysis using SPR designed to determine the ScMcm10:DNA stoichiometry in the nucleoprotein complex. Sensor chips containing ARS1–400 DNA (harboring an Abf1p-binding site), ARS1–25, and ARS1–50 were prepared as described under “Experimental Procedures.” The amount of DNA ligand retained on the surface of the chip (Rl, measured in RU units) was 296, 29, and 56 for ARS1–400, ARS1–25, and ARS1–50, respectively. B, real-time kinetics of Abf1p binding to ARS1–400. In this experiment we generated kinetic curves by applying different concentrations (0.1 to 50 nm, see “Experimental Procedures”) of Abf1p flowing through the chip containing ARS1–400 DNA (red curves). These curves were fitted with kinetic curves generated by an evaluation model (Langmuir) relying on a 1:1 interaction at surface (black curves). C, represents kinetic analysis of ScMcm10 binding to ARS1–25, as in B. D, represents kinetic analysis of ScMcm10 binding to ARS1–50, essentially as described in B. E, kinetic parameters calculated by a computer program based on the “fitted” kinetic curves (black) shown in B–D. The stoichiometry of Abf1p or ScMcm10 bound to DNA was calculated by the formula described under “Experimental Procedures.” A computer program calculated the amounts of Abf1p and ScMcm10 at saturation. These amounts (expressed as Rmax units) were 98.3 in B, 62.7 in C, and 154.5 in D.
FIGURE 3.
FIGURE 3.
The amount of ScMcm10 bound to dsDNA is directly proportional to the size of the DNA. A, represents a plot of ScMcm10 stoichiometry as a function of the size of dsDNA. The ScMcm10:ARS1–50 stoichiometry was determined in Fig. 2. The stoichiometry of ScMcm10 bound to ARS1–75, ARS1–100, ARS1–200, and ARS-400 was determined in supplemental Fig. S.4. The stoichiometry of ScMcm10 bound to the 300-bp-long fragment was determined by an identical kinetic analysis described in Figs. 2 and S.4, except that the DNA ligand used was ARS1501-300 (data not shown). In parenthesis is the average number of base pairs occluded by a single ScMcm10 molecule. B, DNA affinity curves are based on the kinetic data described in Fig. 2D for ARS1–50 and supplemental Fig. S.4 (c and g) for ARS1–100 and ARS1–400, respectively. DNA binding saturated at 12.5 nm ScMcm10 in the case of ARS1–50 and ARS1–100 and at 25–50 nm of ScMcm10 in the case of ARS1–400.
FIGURE 4.
FIGURE 4.
Assembly of a ScMcm10 multimeric complex on ssDNA. To determine whether ScMcm10 binds to ssDNA, we performed DNA competition experiments (A). The DNA substrate used was 32P-labeled ARS1501-300. The competing DNA used were øX174 ssDNA, ssDNA-60, and ssDNA-21 oligonucleotides. Analysis of direct binding to ssDNA was performed by SPR. B–G represent real-time kinetics of ScMcm10 binding to ssDNA oligonucleotides of different length. B, in this experiment we generated kinetic curves by applying different concentrations (0.1 to 50 nm, see “Experimental Procedures”) flowing over a chip containing immobilized ssDNA-8 oligonucleotide (red curves). Similar experiments are presented in C–F, except that ssDNA-12, ssDNA-20, ssDNA-30, and ssDNA-40 were captured on the chips, respectively. These curves were fitted with kinetic curves generated by an evaluation model (Langmuir) relying on a 1:1 interaction at surface (black curves), as in Fig. 2. The amounts of captured ssDNA on a chip, measured in RU units, were as follows: 8, 8, 11, 17, and 23 in B–F, respectively. A computer program calculated the amounts of ScMcm10 bound at saturation. These amounts (expressed as Rmax units) were 114 in C, 404 in D, 347 in E, and 451 in F. G, kinetic parameters calculated by a computer program based on the “fitted” kinetic curves shown in C–F. The stoichiometry of ScMcm10 bound to DNA was calculated by the formula described under “Experimental Procedures.”
FIGURE 5.
FIGURE 5.
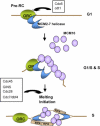
A hypothetical model describing how ScMcm10 may work in DNA replication. This hypothetical diagram describes the possible roles of ScMcm10 in initiation and elongation of DNA replication. The model describes the mechanism for recruitment and binding of ScMcm10 to origins of replication of S. cerevisiae. It also suggests a function for ScMcm10 in bridging the MCM2–7 to the DNA, formation of a replication bubble, and transfer of the MCM2–7 complex to nascent replication forks. ORC (origin recognition complex), MCM2–7 helicase complex, Mcm10, and RPA (ssDNA-binding protein) are as designated. All aspects of this model are discussed in detail under “Discussion.”

Similar articles

Cited by

References

    1. Maine G. T., Sinha P., Tye B. K. (1984) Genetics 106, 365–385 - PMC - PubMed
    1. Dumas L. B., Lussky J. P., McFarland E. J., Shampay J. (1982) Mol. Gen. Genet. 187, 42–46 - PubMed
    1. Izumi M., Yanagi K., Mizuno T., Yokoi M., Kawasaki Y., Moon K. Y., Hurwitz J., Yatagai F., Hanaoka F. (2000) Nucleic Acids Res. 28, 4769–4777 - PMC - PubMed
    1. Wohlschlegel J. A., Dhar S. K., Prokhorova T. A., Dutta A., Walter J. C. (2002) Mol. Cell 9, 233–240 - PubMed
    1. Gregan J., Lindner K., Brimage L., Franklin R., Namdar M., Hart E. A., Aves S. J., Kearsey S. E. (2003) Mol. Biol. Cell 14, 3876–3887 - PMC - PubMed

Publication types