. 2009 Sep 4;284(36):23995-4005.
doi: 10.1074/jbc.M109.024398. Epub 2009 Jul 15.

Dynamin2 GTPase and cortactin remodel actin filaments

Affiliations

Dynamin2 GTPase and cortactin remodel actin filaments

Olivia L Mooren et al. J Biol Chem. .

Abstract

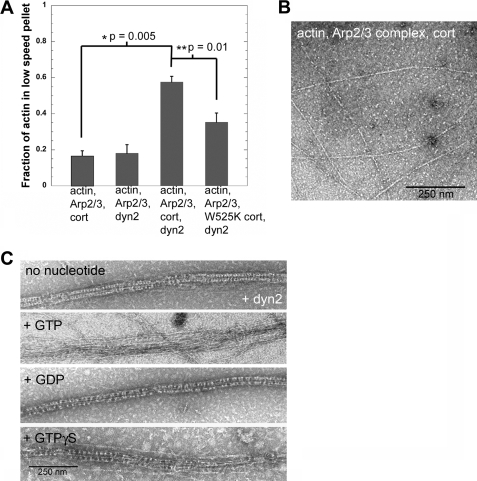
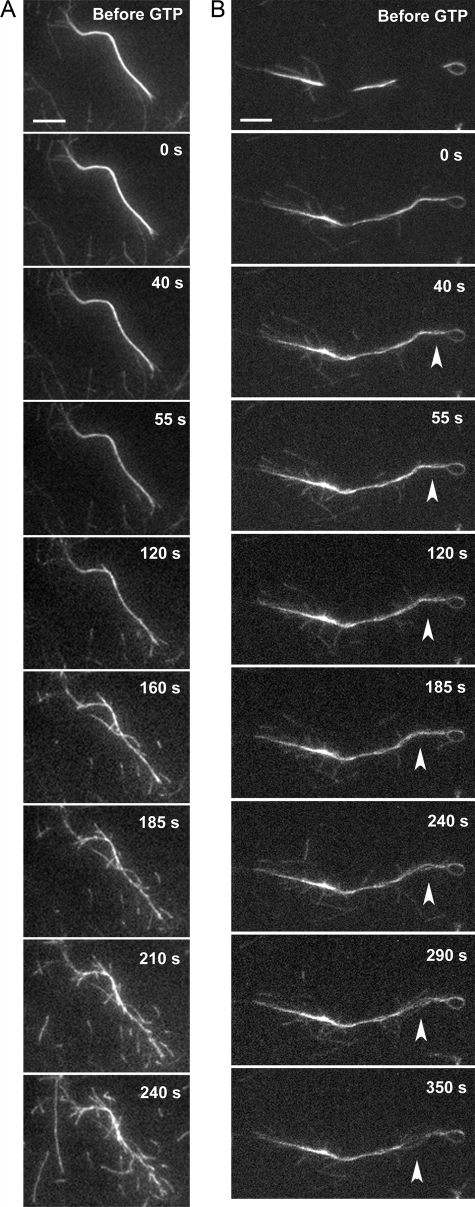
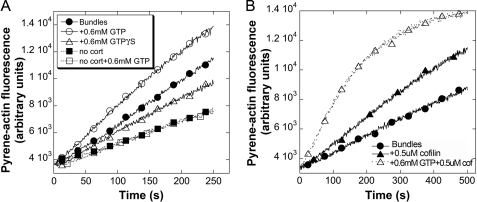
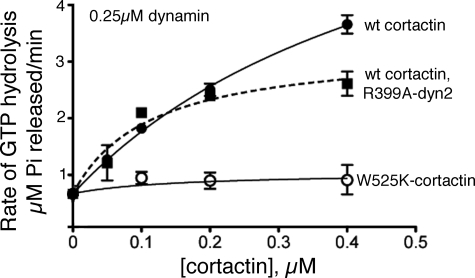
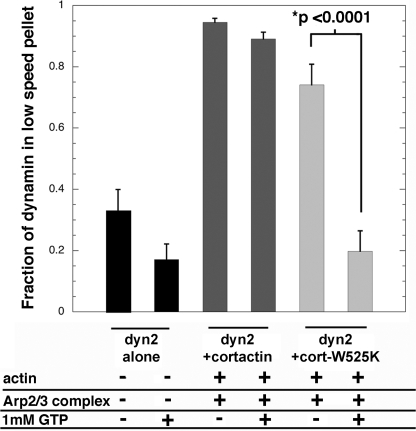
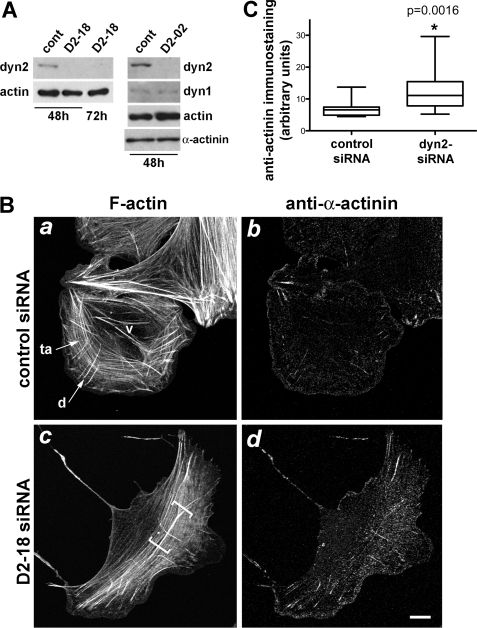
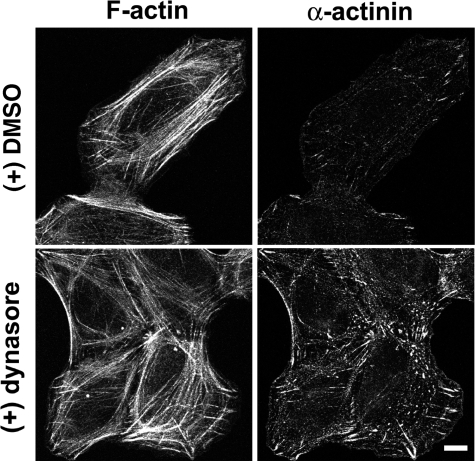
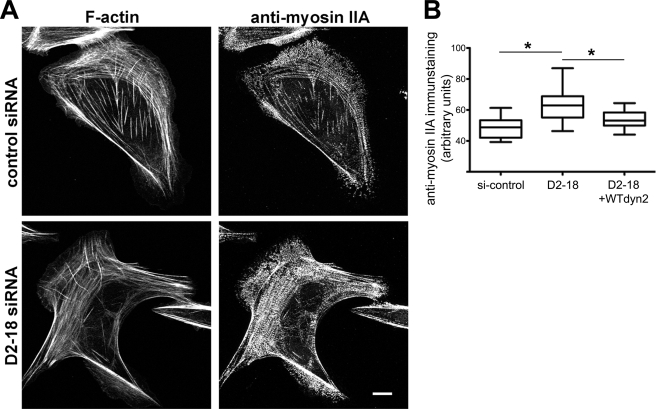
The large GTPase dynamin, best known for its activities that remodel membranes during endocytosis, also regulates F-actin-rich structures, including podosomes, phagocytic cups, actin comet tails, subcortical ruffles, and stress fibers. The mechanisms by which dynamin regulates actin filaments are not known, but an emerging view is that dynamin influences F-actin via its interactions with proteins that interact directly or indirectly with actin filaments. We show here that dynamin2 GTPase activity remodels actin filaments in vitro via a mechanism that depends on the binding partner and F-actin-binding protein, cortactin. Tightly associated actin filaments cross-linked by dynamin2 and cortactin became loosely associated after GTP addition when viewed by transmission electron microscopy. Actin filaments were dynamically unraveled and fragmented after GTP addition when viewed in real time using total internal reflection fluorescence microscopy. Cortactin stimulated the intrinsic GTPase activity of dynamin2 and maintained a stable link between actin filaments and dynamin2, even in the presence of GTP. Filaments remodeled by dynamin2 GTPase in vitro exhibit enhanced sensitivity to severing by the actin depolymerizing factor, cofilin, suggesting that GTPase-dependent remodeling influences the interactions of actin regulatory proteins and F-actin. The global organization of the actomyosin cytoskeleton was perturbed in U2-OS cells depleted of dynamin2, implicating dynamin2 in remodeling actin filaments that comprise supramolecular F-actin arrays in vivo. We conclude that dynamin2 GTPase remodels actin filaments and plays a role in orchestrating the global actomyosin cytoskeleton.


Figures

FIGURE 1.
FIGURE 1.
Dynamin2 and cortactin remodel bundled actin filaments in a GTPase-dependent manner. A, F-actin cross-linking by dynamin2 (dyn2) depends on cortactin. Plotted is the fraction of actin pelleted after low speed centrifugation (18,000 × g for 30 min) in reactions containing 1.5 μm actin, 50 nm Arp2/3 complex, 500 nm cortactin (cort), or 500 nm cortactin-W525K and 500 nm dynamin2, as indicated. Data plotted are the mean from three to four experiments; error bars indicate the S.E. Representative SDS gels are shown in supplemental Fig. S1B. B, transmission electron micrograph of negatively stained actin filaments formed after 10 min by 1.5 μm actin, 50 nm Arp2/3 complex, and 500 nm cortactin. Scale bar is 250 nm. C, transmission electron micrographs of negatively stained actin filaments formed after 10 min by 1.5 μm actin, 50 nm Arp2/3 complex, 500 nm cortactin, and 500 nm dynamin2. Filaments were assembled in the absence of guanine nucleotide for 10 min, followed by a 2-min incubation with 0.4 mm GTP, 1 mm GDP, 0.4 mm GTPγS, or buffer, as indicated. Scale bar is 250 nm.
FIGURE 2.
FIGURE 2.
Observing dynamin2 GTPase-dependent filament remodeling in real time. Time-lapse series shows Alexa 488-labeled actin filaments formed by Arp2/3 complex, cortactin, and dynamin2 following addition of 1 mm GTP to the reaction. The numbers indicate the time in seconds following GTP addition. A, actin filaments grow from the sides of uniformly bundled filaments ∼120 s after addition of 1 mm GTP, resulting in a “frayed” appearance along the length of the bundled filaments. At later times short filaments fall onto the coverslip surface from above. This sequence of images corresponds to supplemental Movie S1. Scale bar is 5 μm. B, GTPase-dependent unraveling of actin filaments in a region along a bundle that is not attached to the coverslip surface (arrowhead). This sequence of images corresponds to supplemental Movie S2. Scale bar is 5 μm.
FIGURE 3.
FIGURE 3.
GTP hydrolysis by dynamin2 reveals actin filament-barbed ends and increases the sensitivity of filaments in bundles to cofilin. A, actin filaments were polymerized 1 h in the presence of 50 nm Arp2/3 complex and 500 nm dynamin2, with (circles and triangles) or without 500 nm cortactin (squares), creating bundled filament seeds. Seeds were treated for 45 s with 0.6 mm GTP (open circles and squares), 0.6 mm GTPγS (open triangles), or with buffer (filled circles and squares) prior to dilution into 2.0 μm G-actin (10% pyrene-labeled). Plotted is the fluorescence of pyrene-actin versus time after dilution. B, bundled filament seeds pre-formed for 1 h were treated with 0.6 mm GTP (open triangles) or with buffer (closed triangles) for 15 s prior to addition of 0.5 μm cofilin for 30 s. Seeds were diluted into 2 μm G-actin (10% pyrene-labeled) and the fluorescence of pyrene-actin was recorded versus time after dilution.
FIGURE 4.
FIGURE 4.
Cortactin stimulates the intrinsic GTPase activity of dynamin2. Plotted are the initial rates of GTP hydrolysis catalyzed by 0.25 μm dynamin2 (circles) or 0.25 μm dynamin2-R399A (squares) with increasing concentrations of wild type (WT) cortactin (filled circles and squares) or cortactin-W525K (open circles). Reactions contained 0.25 mm GTP. Data are presented as the mean initial rate ± S.E. obtained from four to seven experiments. Lines show the fit of the data to a hyperbolic function after correction for the rate of GTP hydrolysis in the absence of cortactin.
FIGURE 5.
FIGURE 5.
Cortactin stabilizes the interaction of dynamin2 and actin filaments in the presence of GTP. Plotted is the fraction of dynamin2 associated with bundled actin filaments obtained after low speed centrifugation in reactions treated, or not, with GTP. Actin filaments were pre-formed from 1.5 μm actin, 50 nm Arp2/3 complex, 500 nm cortactin (or 500 nm cortactin-W525K), and 500 nm dynamin2 for 30 min, then treated with either 1 mm GTP or buffer for 5 min before low speed centrifugation at 18,000 × g for 10 min. A control reaction with dynamin2 alone (black bars, n = 4) showed that ∼30% of dynamin2 sedimented independent of the other components, presumably due to self-assembly at the ionic conditions used; other reactions contained actin, dynamin2, and either wild type cortactin (dark gray bars, n = 4) or mutant cortactin-W525K (light gray bars, n = 3) as indicated. Data are presented as the mean ± S.E. obtained from three to four experiments. Error bars indicate the S.E.
FIGURE 6.
FIGURE 6.
Dynamin2 influences the distributions of F-actin and α-actinin in U2-OS cells. A, dynamin2 was efficiently depleted from U2-OS cells using two different siRNAs targeting human dynamin2. Cell extracts obtained 48–72 h after treatment with control siRNA (cont) and siRNAs targeting dynamin2 (D2-02 and D2-18) were analyzed for dynamin2, dynamin1, actin, and α-actinin. Extracts were prepared from equal numbers of cells in all samples and equal volumes were loaded in each lane. B, cells were fixed and stained with rhodamine-phalloidin (a and c) and anti-α-actinin (b and d) 48 h after transfection with control (a and b) or dynamin2-specific (D2-18) (c and d) siRNAs. The predominant types of stress fibers elaborated by U2-OS cells are labeled in panel a: ta, transverse arc; d, dorsal stress fiber; v, ventral stress fiber; the diffuse transverse arcs in dynamin2-depleted cells are indicated with brackets in panel c and correspond to regions where staining for α-actinin is enhanced. Representative cells are shown for each condition; additional images of control and dynamin2-depleted cells stained to reveal F-actin and α-actinin are provided in supplemental Fig. S3. Scale bar is 10 μm. C, box and whisker plot shows the integrated fluorescence intensity/area for anti-α-actinin immunostaining in control siRNA-treated and dynamin2 siRNA-treated U2-OS cells. Data were collected from 17 cells in each group; boxes indicate the median value and the upper and lower quartile values, and whiskers indicate the minimum and maximum values of the data. * indicates p = 0.0016.
FIGURE 7.
FIGURE 7.
Acute perturbation of dynamin with dynasore influences α-actinin distribution but not the overall F-actin organization. U2-OS cells were treated with 80 μm dynasore or DMSO (0.4%) for 20 min at 37 °C before fixing and immunostaining with anti-α-actinin (right panels) and rhodamine-phalloidin (left panels). Scale bar is 10 μm.
FIGURE 8.
FIGURE 8.
Dynamin2 influences the distributions of F-actin and non-muscle myosin IIA; exogenous rat dynamin2 restores the myosin IIA distribution in U2-OS cells. A, cells were fixed and stained with rhodamine-phalloidin (left panels) or anti-myosin IIA (right panels) 48 h after transfection with control (upper panels) or dynamin2-specific (D2-18) siRNAs. Representative cells are shown for each condition; additional images of actomyosin distributions in control and dynamin2-depleted cells are shown in supplemental Fig. S4. Scale bar is 10 μm. B, box and whisker plot shows the integrated fluorescence intensity/area of anti-α-actinin immunostaining in control siRNA-treated, D2-18 siRNA-treated and D2-18 siRNA-treated cells injected with a plasmid driving expression of rat wild type dynamin2 for 6 h before fixing. Data were collected from 19 to 26 cells in each group; boxes indicate the median value and upper and lower quartile values, and whiskers indicate the minimum to maximum values of each data set. * indicates p < 0.0001.

References

    1. Pollard T. D., Borisy G. G. (2003) Cell 112, 453–465 - PubMed
    1. Loisel T. P., Boujemaa R., Pantaloni D., Carlier M. F. (1999) Nature 401, 613–616 - PubMed
    1. Upadhyaya A., van Oudenaarden A. (2003) Curr. Biol. 13, R734–R744 - PubMed
    1. Akin O., Mullins R. D. (2008) Cell 133, 841–851 - PMC - PubMed
    1. Orth J. D., McNiven M. A. (2003) Curr. Opin. Cell Biol. 15, 31–39 - PubMed

Publication types

LinkOut - more resources