DNA methylation and gene expression differences in children conceived in vitro or in vivo
- PMID: 19605411
- PMCID: PMC2748887
- DOI: 10.1093/hmg/ddp319
DNA methylation and gene expression differences in children conceived in vitro or in vivo
Abstract
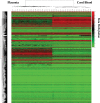
Epidemiological data indicate that children conceived in vitro have a greater relative risk of low birth-weight, major and minor birth defects, and rare disorders involving imprinted genes, suggesting that epigenetic changes may be associated with assisted reproduction. We examined DNA methylation at more than 700 genes (1536 CpG sites) in placenta and cord blood and measured gene expression levels of a subset of genes that differed in methylation levels between children conceived in vitro versus in vivo. Our results suggest that in vitro conception is associated with lower mean methylation at CpG sites in placenta and higher mean methylation at CpG sites in cord blood. We also find that in vitro conception-associated DNA methylation differences are associated with gene expression differences at both imprinted and non-imprinted genes. The range of inter-individual variation in gene expression of the in vitro and in vivo groups overlaps substantially but some individuals from the in vitro group differ from the in vivo group mean by more than two standard deviations. Several of the genes whose expression differs between the two groups have been implicated in chronic metabolic disorders, such as obesity and type II diabetes. These findings suggest that there may be epigenetic differences in the gametes or early embryos derived from couples undergoing treatment for infertility. Alternatively, assisted reproduction technology may have an effect on global patterns of DNA methylation and gene expression. In either case, these differences or changes may affect long-term patterns of gene expression.
Figures


References
-
- Society for Assisted Reproductive Technology. 2008. National data Summary Retrieved from https://www.sartcorsonlinecom/rptCSR_PublicMultYearaspx?ClinicPKID=0 .
-
- Gosden R., Trasler J., Lucifero D., Faddy M. Rare congenital disorders, imprinted genes and assisted reproductive technology. Lancet. 2003;361:1975–1977. - PubMed
-
- European Society of Human Reproduction and Embryology (ESHRE) 2006. 2002 World Report on Assisted Reproduction Technology. - PubMed
-
- Ericson A., Kallen B. Congenital malformations in infants born after IVF: a population-based study. Hum. Reprod. 2001;16:504–509. - PubMed
-
- Koivurova S., Hartikainen A.L., Gissler M., Hemminki E., Sovio U., Jarvelin M.R. Neonatal outcome and congenital malformations in children born after in-vitro fertilization. Hum. Reprod. 2002;17:1391–1398. - PubMed
Publication types
MeSH terms
Grants and funding
LinkOut - more resources
Full Text Sources
Other Literature Sources
Molecular Biology Databases

