. 2009 Jul 15;29(28):9050-8.
doi: 10.1523/JNEUROSCI.1760-09.2009.

The foveal confluence in human visual cortex

Affiliations

The foveal confluence in human visual cortex

Mark M Schira et al. J Neurosci. .

Abstract

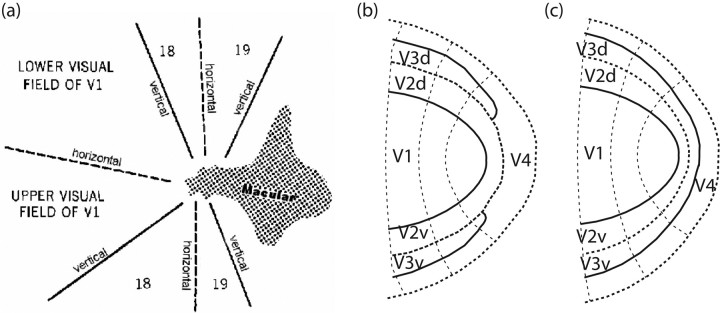
The human visual system devotes a significant proportion of its resources to a very small part of the visual field, the fovea. Foveal vision is crucial for natural behavior and many tasks in daily life such as reading or fine motor control. Despite its significant size, this part of cortex is rarely investigated and the limited data have resulted in competing models of the layout of the foveal confluence in primate species. Specifically, how V2 and V3 converge at the central fovea is the subject of debate in primates and has remained "terra incognita" in humans. Using high-resolution fMRI (1.2 x 1.2 x 1.2 mm(3)) and carefully designed visual stimuli, we sought to accurately map the human foveal confluence and hence disambiguate the competing theories. We find that V1, V2, and V3 are separable right into the center of the foveal confluence, and V1 ends as a rounded wedge with an affine mapping of the foveal singularity. The adjacent V2 and, in contrast to current concepts from macaque monkey, also V3 maps form continuous bands (approximately 5 mm wide) around the tip of V1. This mapping results in a highly anisotropic representation of the visual field in these areas. Unexpectedly, for the centermost 0.75 degrees, the cortical representations for both V2 and V3 are larger than that of V1, indicating that more neuronal processing power is dedicated to second-level analysis in this small but important part of the visual field.


Figures

Figure 1.
Figure 1.
Possible layouts of the foveal confluence. a, The first concept of the foveal confluence as suggested by Zeki (1969), based on studies of macaque monkey. b, Layout of the foveal confluence that has the most support (Newsome et al., 1986; Maunsell and van Essen, 1987; Gattass et al., 1988, 2005) (based on data from macaque monkey). c, Alternative layout of the foveal confluence (Pinon et al., 1998; Rosa et al., 2000; Rosa and Tweedale, 2000, 2005) based on results in marmoset and cebus monkey.
Figure 2.
Figure 2.
Illustration of the high-resolution protocols used in this study. a, Illustration of the slice orientation and location. The slice orientation was tilted to reduce distortion. (Note that this illustration contains only 16 slices instead of 27, which would be too fine for the resolution of this print.) b, Superposition of functional and anatomical data. Anatomical data are in gray scale, functional data in red–yellow. There is substantial structural information in the functional data. This structural information was used for careful alignment. Note that the T2*-weighted EPI scans and the T1-weighted scans have inverted contrast properties. c, As for b but with the red EPI image thresholded for brightness, i.e., voxels below a threshold luminance in the EPI scan are made transparent and accordingly replaced by the T1 image (gray). This view is particularly useful to check the precision of the spatial alignment between the anatomical (T1) and functional (EPI) scans and further to detect any distortion. Ideally, the remaining red–yellow image should fill the dark sulci of the anatomy.
Figure 3.
Figure 3.
The benefits of high-resolution fMRI. a, A single EPI image slice depicting the high amount of structural information in the EPI data. The results of the retinotopic analysis are projected onto this slice in color. The data have been statistically thresholded, and the color map depicts retinotopic location (not level of significance). The right-hand graph shows the time course of three neighboring voxels taken from the area depicted by the tiny red rectangle. The three voxels are adjacent and picked so that they span a gyrus, with two gray matter voxels (designated as green and blue) sampling retinotopically distinct locations on two sides of a gyrus. In 3D space, the third voxel is located between these two gray matter voxels but samples white matter and shows no retinotopic response. All three voxels are within 3.6 mm and accordingly would be sampled by a single EPI voxel at the typical EPI resolution of 3 mm. b, The result of thresholded statistical analysis interpolated into the 3D space of the T1 anatomy. It is evident that significant activity is restricted to gray matter and accurately follows the fine structure of the subjects' anatomy.
Figure 4.
Figure 4.
Result of the polar angle study for a single subject and hemisphere. Left and center, Projected on the reconstructed and inflated 3D surface of the subject's cortical surface. On the right is shown a flattened patch of the subject's cortex around the occipital pole, which intuitively provides a convenient overview of the important features. Although these flat maps depict the global layout of the cortical response topography, they contain some degree of distortion and size scaling, and hence should only be interpreted for relative location.
Figure 5.
Figure 5.
Retinotopic maps of all 10 hemispheres. The eccentricity maps are given on the left. Note the explicit eccentricity scale (bottom left) going down to 0.1° eccentricity. The polar angle maps are shown on the right. Vertical meridians are marked with continuous lines and horizontal meridians with dotted lines. The horizontal and vertical meridians and their confidence intervals (white) in this figure result from a bootstrapping analysis to estimate the spatial uncertainty of our measurement of visual area border. A high-resolution figure with and without these markings and one with manually identified borders are provided in the supplemental material, available at www.jneurosci.org.
Figure 6.
Figure 6.
Quantitative analysis of isoeccentricity and isopolar lines. a, The vertical meridian representation that forms the anterior V3 border across all 10 measured hemispheres, as indicated by the red line in the pictogram on the left. The red curve shows the polar position estimate and the blue curve the eccentricity estimate, an ideal curve would be as step function switching from −90 to +90 in the center. The blue curve depicts eccentricity along the same line; here, the ideal curve would be V shaped. The data are averaged across subjects based on distance from the foveal center, with distance measured within the 3D surface reconstructions rather than in flattened patches. b, Polar position along isoeccentricity lines starting on the V1/V2 border, crossing V2 and V3, and ending at the anterior border of V3. Again, the position of the lines are depicted on the left. Ideally, the curves should be V shaped, too. Ventral curves should start at +90 and go down to 0, whereas dorsal curves should go from −90 to 0 and return to −90. Distance measurements are normalized to the mean length for this eccentricity. Filled circles represent data from the dorsal, squares from the ventral quarter field.
Figure 7.
Figure 7.
Surface area analysis based on the six hemispheres with full coverage. a, Foveal magnification function; error bars depict the SE across measured hemispheres. For eccentricities of 1° and greater, V1 has a larger magnification than V2 or V3, but for 0.5° and below, both V2 and V3 are larger than V1. b, Surface areas in early visual areas for foveal representations (0–0.6°) and parafoveal representations (0.6–4.8°). For foveolar eccentricities V1 is significantly smaller than V2 and V3.
Figure 8.
Figure 8.
Proposed canonical model of the foveal confluence in human. a, Schematic model for human V1–V3 and lateral occipital regions. b, Theoretical structure for the meridional (top) and eccentricity (bottom) parameters according to the model. c, The theoretical structure projected on the flattened surface from one of our subjects and morphed to fit the data. d, Measured data of this subject; the red circles indicate two further representations of the foveal projection, representing the V3A/V3B and the VO foveal projections, respectively. dor., Dorsal; lat., lateral; vent., ventral; med., medial.

References

    1. Dougherty RF, Koch VM, Brewer AA, Fischer B, Modersitzki J, Wandell BA. Visual field representations and locations of visual areas V1/2/3 in human visual cortex. J Vis. 2003;3:586–598. - PubMed
    1. Engel SA, Rumelhart DE, Wandell BA, Lee AT, Glover GH, Chichilnisky EJ, Shadlen MN. fMRI of human visual cortex. Nature. 1994;369:525. - PubMed
    1. Gattass R, Sousa AP, Gross CG. Visuotopic organization and extent of V3 and V4 of the macaque. J Neurosci. 1988;8:1831–1845. - PMC - PubMed
    1. Gattass R, Nascimento-Silva S, Soares JG, Lima B, Jansen AK, Diogo AC, Farias MF, Botelho MM, Mariani OS, Azzi J, Fiorani M. Cortical visual areas in monkeys: location, topography, connections, columns, plasticity and cortical dynamics. Philos Trans R Soc Lond B Biol Sci. 2005;360:709–731. - PMC - PubMed
    1. Hansen KA, Kay KN, Gallant JL. Topographic organization in and near human visual area V4. J Neurosci. 2007;27:11896–11911. - PMC - PubMed

Publication types

LinkOut - more resources