. 2009 Jul 15;29(28):9127-36.
doi: 10.1523/JNEUROSCI.5971-08.2009.

Postsynaptic mechanisms govern the differential excitation of cortical neurons by thalamic inputs

Affiliations

Postsynaptic mechanisms govern the differential excitation of cortical neurons by thalamic inputs

Court Hull et al. J Neurosci. .

Abstract

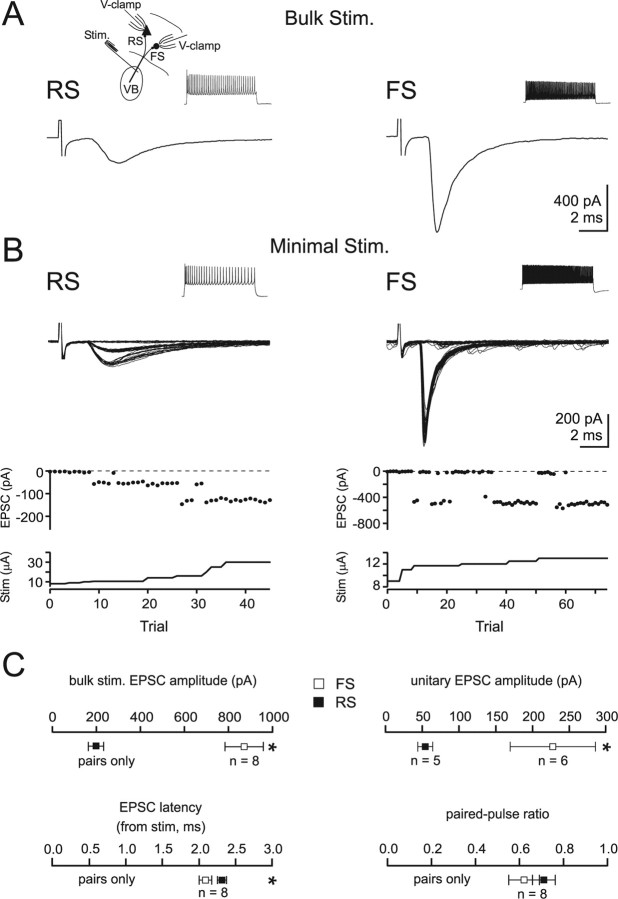
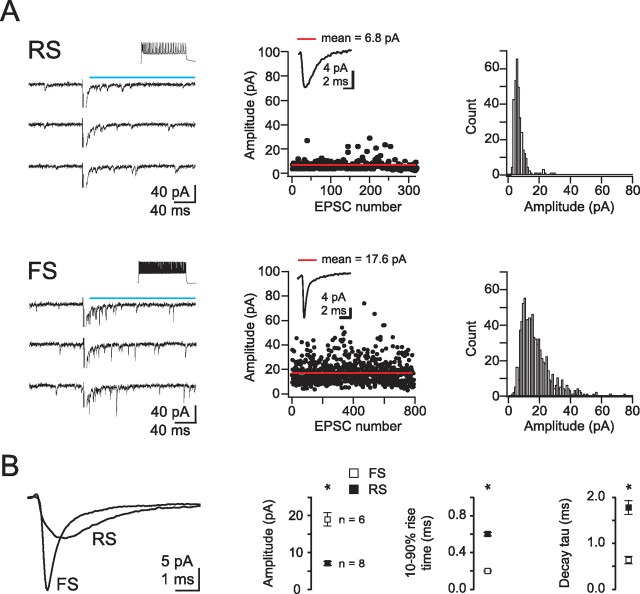
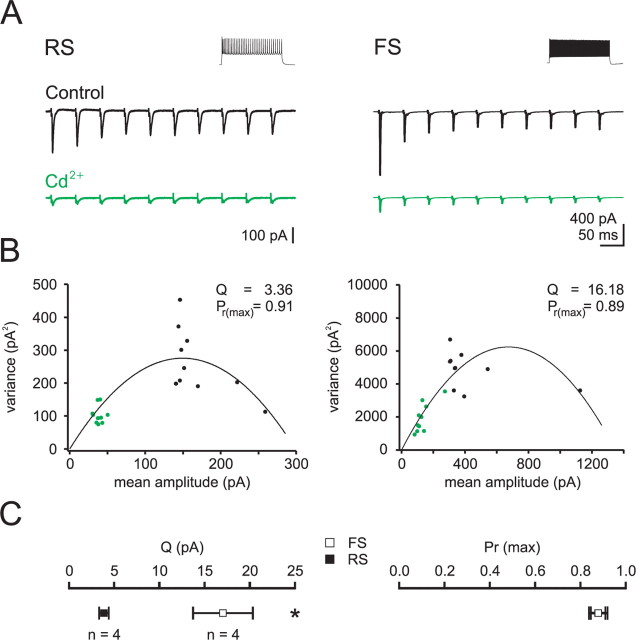
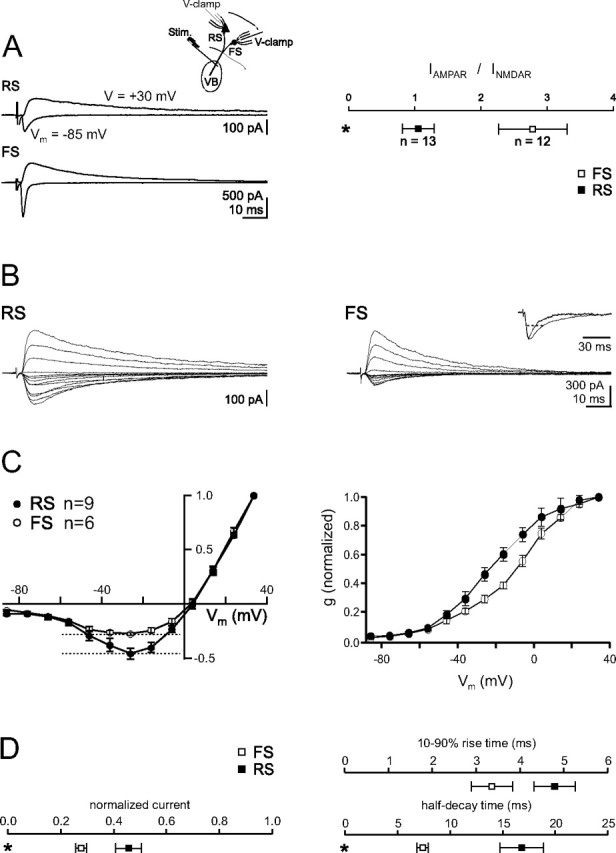
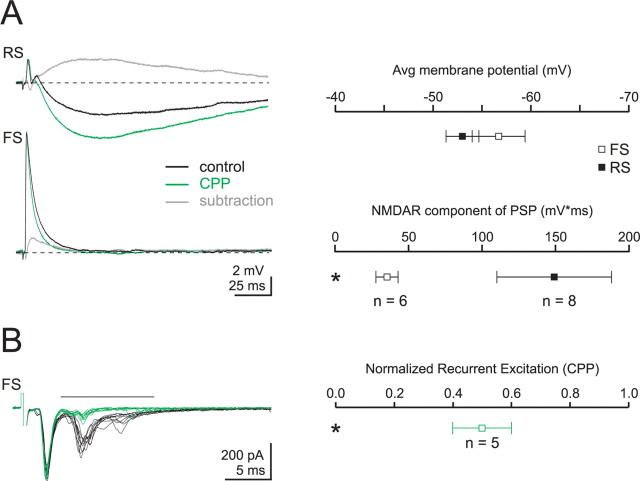
Thalamocortical (TC) afferents relay sensory input to the cortex by making synapses onto both excitatory regular-spiking principal cells (RS cells) and inhibitory fast-spiking interneurons (FS cells). This divergence plays a crucial role in coordinating excitation with inhibition during the earliest steps of somatosensory processing in the cortex. Although the same TC afferents contact both FS and RS cells, FS cells receive larger and faster excitatory inputs from individual TC afferents. Here, we show that this larger thalamic excitation of FS cells occurs via GluR2-lacking AMPA receptors (AMPARs), and results from a fourfold larger quantal amplitude compared with the thalamic inputs onto RS cells. Thalamic afferents also activate NMDA receptors (NMDARs) at synapses onto both cells types, yet RS cell NMDAR currents are slower and pass more current at physiological membrane potentials. Because of these synaptic specializations, GluR2-lacking AMPARs selectively maintain feedforward inhibition of RS cells, whereas NMDARs contribute to the spiking of RS cells and hence to cortical recurrent excitation. Thus, thalamic afferent activity diverges into two routes that rely on unique complements of postsynaptic AMPARs and NMDARs to orchestrate the dynamic balance of excitation and inhibition as sensory input enters the cortex.


Figures

Figure 1.
Figure 1.
TC afferents evoke GluR2-lacking AMPAR-mediated EPSCs onto FS cells. A, Left, EPSCs evoked by TC stimulation and recorded in an RS and an FS cell voltage clamped at membrane potentials ranging from −76 to +44 mV, in gabazine (10 μm) and CPP (25 μm). Middle, Summary data of current–voltage relationships for TC-evoked EPSCs. Membrane potentials are corrected for liquid junction potential. Currents are normalized to the peak negative current, and 100 μm spermine is included in the patch pipettes. Right, Summary of rectification index (+34/−36 mV); filled square, RS cells; open square, FS cells. Only the FS cells show AMPAR-mediated current rectification. Asterisk denotes statistical significance. B, Left, EPSCs evoked by TC stimulation and recorded simultaneously in an RS and an FS cell voltage clamped at the reversal potential for IPSCs (EIPSC). Only the EPSC recorded in the FS cell is reduced in the presence of the GluR2-lacking AMPAR blocker NASPM (50 μm, green traces). Inset represents recording configuration. Abbreviations, here and in subsequent figures: VB, ventrobasal complex; Stim., stimulation electrode; V-clamp, voltage clamp. Right, Summary data illustrating the normalized EPSC amplitudes after application of NASPM; filled square, RS cells; open square, FS cells. C, NASPM (green) does not affect the rectification of TC EPSCs onto FS cells as compared to control (black). Left, Example traces. Middle, Summary data of current–voltage relationship. The RS cell data (gray, from A) are shown for comparison. Right, Summary of rectification index.
Figure 2.
Figure 2.
TC afferents evoke larger EPSCs onto FS as compared to RS cells. A, Bulk stimulation of TC afferents evokes EPSCs onto an FS and an RS cell recorded simultaneously in voltage clamp at the reversal potential for IPSCs (EIPSC). Insets show the recording configuration and response to 800 ms step depolarizations in current clamp. B, Left, Top, Fifty-one superimposed EPSCs sequentially evoked by minimal stimulation of TC afferents and recorded in an RS cell voltage clamped at EIPSC. Note the presence of success and failures. Bottom, The EPSC amplitude is plotted against trial number, with stimulus intensity displayed beneath. Note that progressively increasing stimulus intensity leads initially to a reduction in failures without increasing the amplitude of successes. Further increases in stimulus intensity lead to a step-like transition to a larger EPSC. Right, Same experiment for an FS cell, 76 superimposed sweeps. Note the larger unitary amplitude of TC EPSCs onto the FS cell. C, Summary data of amplitude, latency, and paired pulse ratio of EPSCs evoked by stimulation of TC afferents and recorded in FS and RS cells.
Figure 3.
Figure 3.
Larger quantal amplitude of TC inputs onto FS as compared to RS cells. A, Left, Three individual sweeps illustrate asynchronous release elicited by thalamic stimulation and recorded in RS (top) or FS (bottom) cells after replacing calcium with 4 mm strontium. The blue line illustrates the 200 ms time window within which quanta were analyzed. Inset, Response to 800 ms step depolarizations in current clamp. Middle, Plot of event amplitude against trial number illustrating response stability. Inset, Average asEPSC. Right, Distributions of quantal events. Note larger asEPSC amplitudes for FS as compared to RS cells. B, Left, asEPSCs averaged across cells. Right, Summary data of amplitudes, rise times, and decay time constants for asEPSCs recorded in FS cells (open squares) and RS cells (closed squares). Decay times were fitted with a single exponential. Note that both the rise time and decay time constant of asEPSCs recorded in FS cells were faster than those recorded in RS cells.
Figure 4.
Figure 4.
Larger quantal amplitude but similar release probability of TC inputs onto FS as compared to RS cells. A, EPSCs recorded in RS (left) and FS (right) cells voltage clamped at EIPSC in response to repetitive bulk stimulation of TC afferents (20 Hz) under control conditions (black) and in the presence of cadmium (30 μm, green). Insets show response to an 800 ms step depolarization in current clamp. B, The mean amplitude of each EPSC in the train is plotted against its respective variance (measured at the peak of the EPSC). Black and green data points represent EPSCs recorded in control and cadmium, respectively. The data are fit with a parabolic function based on a multinomial model (see Materials and Methods). C, Summary data: note that while the quantal amplitude (Q) is 4.4-fold larger in FS as compared to RS cells, the probability of release (Pr) is similar.
Figure 5.
Figure 5.
Distinct properties of NMDAR-mediated EPSCs evoked by TC afferents onto RS and FS cells. A, Left, EPSCs elicited by bulk stimulation of TC afferents and recorded simultaneously in a voltage-clamped RS cell (top) and FS cell (bottom). The outward, pharmacologically isolated NMDAR-mediated EPSC was recorded +30 mV above the reversal potential in the presence of the AMPAR antagonist NBQX (10 μm) and the GABAAR antagonist gabazine (10 μm). The inward, AMPAR-mediated EPSC was isolated by digital subtraction of the EPSC recorded at −85 mV (EIPSC) in the presence of NBQX and gabazine from the EPSC recorded at the same potential in control conditions. Right, Summary data of the ratio between the peak amplitudes of the AMPAR- and NMDAR-mediated EPSCs, isolated as described above. Note the larger AMPAR–NMDAR ratio of EPSCs recorded in FS cells. B, Current–voltage relationship of NMDAR-mediated EPSCs elicited by stimulation of TC afferents and recorded in RS cells (left) or FS cells (right) in the presence of NBQX and gabazine. Membrane potentials (corrected for liquid junction potential) were varied between −86 and +34 mV. Currents are scaled to the peak of the EPSC recorded at +34 mV for comparison. Note that NMDAR-mediated EPSCs recorded at negative potentials are relatively larger in RS as compared to FS cells. Inset, Superimposed peak-scaled NMDAR-mediated EPSC recorded in FS and RS cells at −26 mV. Note the faster time course of the EPSC recorded in FS cells. Dotted line, Half-decay time. C, Summary data. Normalized current–voltage relationship (left) and normalized conductance–voltage relationship (right) of NMDAR-mediated EPSCs recorded in FS and RS cells. Note the rightward shift of the conductance–voltage relationship in FS as compared to RS cells. D, Summary data for normalized peak amplitude at −26 mV, rise times, and half-decay times of the NMDAR-mediated EPSCs recorded in FS and RS cells.
Figure 6.
Figure 6.
Blocking GluR2-lacking AMPARs abolishes feedforward inhibition evoked by stimulation of TC afferents. A, Top, Recording configuration. Traces: Bulk stimulation of TC afferents triggers a feedforward IPSC in an RS cell (top, voltage clamped at −65 mV; see Materials and Methods for isolation of IPSC) and an EPSC in a simultaneously recorded FS cell (bottom, voltage clamped at EIPSC). Application of the GluR2-lacking AMPAR blocker NASPM (green) abolishes the feedforward IPSC recorded in the RS cell and decreases the EPSC recorded in the FS cell. In contrast, the EPSC evoked in the RS cell (isolated by voltage clamping the neuron at EIPSC, inset) remains unaffected. Bottom, Summary data. B, Top, Recording configuration (I-clamp: current clamp). Traces: Bulk stimulation of TC afferents triggers an EPSP-IPSP sequence in an RS cell (top, current clamp configuration) and an EPSC in a simultaneously recorded FS cell (bottom, voltage clamped at EIPSC). Application of NASPM (green) abolishes the feedforward IPSP recorded in the RS cell, thereby increasing the amplitude and prolonging the time course of the EPSP. As in A, NASPM decreases the EPSC recorded in the FS cell. Bottom, Summary graph of the effect of NASPM on the peak amplitude and half width of the postsynaptic potential recorded in RS cells. C, Left, Recording configuration as in A. The NMDAR antagonist CPP (25 μm, green) has no effect either on the feedforward IPSC recorded in the RS cell (top) or on the EPSC recorded in the RS cells (inset) or FS cells (bottom). Right, Summary graph.
Figure 7.
Figure 7.
Blocking NMDARs reduces the recurrent polysynaptic excitation evoked by stimulation of TC afferents. A, Left, Response to TC afferent stimulation in an RS (top, black, Vm = −54 mV) and an FS (bottom, black, Vm = −57 mV) cell recorded in the current clamp configuration. Blocking NMDARs with the specific antagonist CPP (25 μm) reveals a larger IPSP in an RS cell (green) but has little effect on the postsynaptic potential recorded in an FS cell. Gray traces, Digital subtraction of the traces recorded in control (black) from the traces recorded in CPP. Note the larger and slower CPP-sensitive component in RS as compared to FS cells. Right, Summary graph of the membrane potential (top) and the integral of the CPP-sensitive component (bottom). Avg, Average. B, Left, Stimulation of TC afferents evokes a monosynaptic EPSC followed by polysynaptic recurrent EPSCs (black traces, 10 superimposed sweeps) in an FS cell voltage clamped at EIPSC. Perfusion of CPP (25 μm; green traces; 10 superimposed sweeps) has no effect on the monosynaptic TC EPSC (consistent with Fig. 6C) but strongly reduces polysynaptic EPSCs. Right, Summary graph of the CPP-mediated reduction in excitatory charge integrated over a 10 ms time window (black horizontal line on left).

References

    1. Agmon A, Connors BW. Thalamocortical responses of mouse somatosensory (barrel) cortex in vitro. Neuroscience. 1991;41:365–379. - PubMed
    1. Ahmed B, Anderson JC, Douglas RJ, Martin KA, Nelson JC. Polyneuronal innervation of spiny stellate neurons in cat visual cortex. J Comp Neurol. 1994;341:39–49. - PubMed
    1. Angulo MC, Rossier J, Audinat E. Postsynaptic glutamate receptors and integrative properties of fast-spiking interneurons in the rat neocortex. J Neurophysiol. 1999;82:1295–1302. - PubMed
    1. Armstrong-James M, Welker E, Callahan CA. The contribution of NMDA and non-NMDA receptors to fast and slow transmission of sensory information in the rat SI barrel cortex. J Neurosci. 1993;13:2149–2160. - PMC - PubMed
    1. Beierlein M, Connors BW. Short-term dynamics of thalamocortical and intracortical synapses onto layer 6 neurons in neocortex. J Neurophysiol. 2002;88:1924–1932. - PubMed

Publication types

MeSH terms

LinkOut - more resources