

doi: 10.1002/ajmg.a.33001.
Morning melatonin levels in Prader-Willi syndrome
Affiliations
- PMID: 19606476
- PMCID: PMC6746401
- DOI: 10.1002/ajmg.a.33001
Item in Clipboard
Morning melatonin levels in Prader-Willi syndrome
Am J Med Genet A.
2009 Aug.
No abstract available
Figures
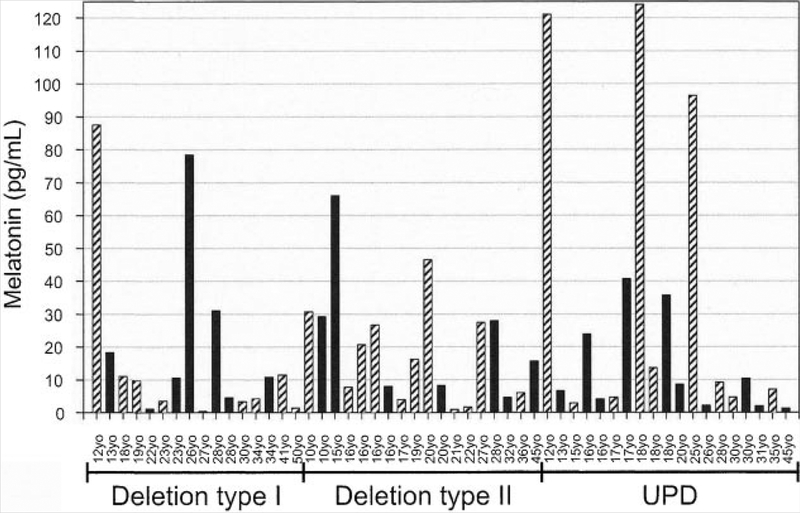
Histogram showing daytime plasma melatonin levels (pg/ml) for subjects with Prader–Willi syndrome according to age, gender and genetic subtype. Solid bars represent males and diagonal bars represent females.
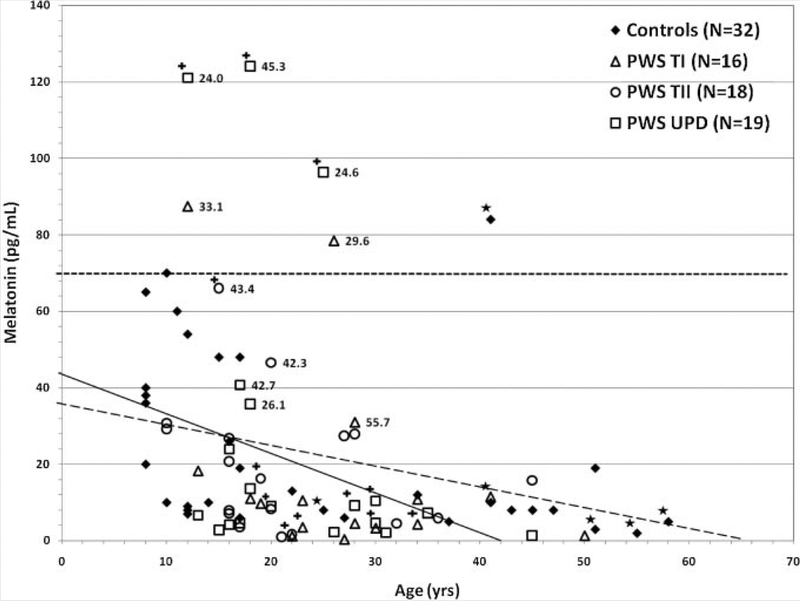
Scatterplot of morning plasma melatonin levels versus age for subjects with Prader–Willi syndrome and controls. Open symbols represent subjects with Prader–Willi syndrome classified by genetic subtype. The closed symbol represents comparison subjects taken from the literature [Laakso et al., 1990; Cavallo, 1992; de Leersynder et al., 2001]and our six control subjects represented by (*) analyzed in our laboratory at the same time as the subjects with Prader–Willi syndrome. All measurements were made by radioimmunoassay on morning fasting plasma samples. The mean ± SD 21.8 ± 29.7 pg/ml (range = 0.4–124 pg/ml; r = 0.316, P = 0.021) for PWS subjects (N = 53) and mean ± SD = 23.9 ± 23.2 pg/ml (range = 1.4–84 pg/ml; r = 0.414,P = 0.018) for control subjects (N 32). The PWS subjects designated with (+) represent those individuals on SSRI medication. The numbers next to the PWS symbol represent the BMI measurements for those PWS subjects with the top 10 melatonin levels. The dash line represents the correlation for the control subjects and the solid line represents the correlation for the PWS subjects. The upper broken line represents the upper limits (+ 2 SD) of the melatonin range (70 pg/ml).
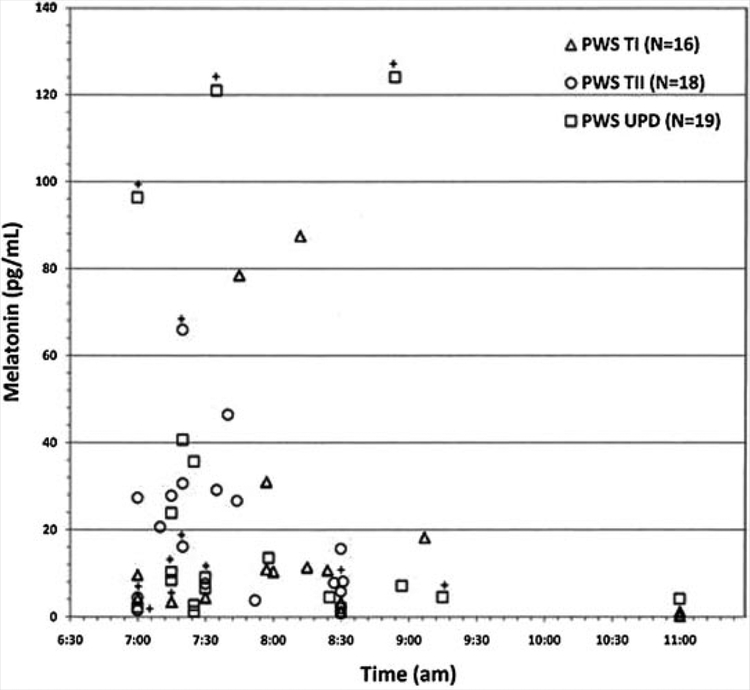
Scatterplot of morning melatonin levels versus time of blood collection. Open symbols represent subjects with Prader–Willi syndrome classified by genetic subtype. The PWS subjects designated with (+) represent those individuals on SSRI medications. The upper limits of normal for the melatonin range is 70 pg/ml.
References
-
- Azeddine B, Letellier K, Wang da S, Moldovan F, Moreau A. 2007. Molecular determinants of melatonin signaling dysfunction in adolescent idiopathic scoliosis. Clin Orthop Relat Res 462:42–52. - PubMed
-
- Bartness TJ, Demas GE, Song CK. 2002. Seasonal changes in adiposity: The roles of the photoperiod, melatonin and other hormones, and sympathetic nervous system. Exp Biol Med (Maywood) 227:363–376. - PubMed
MeSH terms
Substances
Grants and funding
LinkOut - more resources
Full Text Sources
Medical
Molecular Biology Databases
