

Deterministic mathematical models of the cAMP pathway in Saccharomyces cerevisiae
- PMID: 19607691
- PMCID: PMC2719611
- DOI: 10.1186/1752-0509-3-70
Deterministic mathematical models of the cAMP pathway in Saccharomyces cerevisiae
Abstract
Background: Cyclic adenosine monophosphate (cAMP) has a key signaling role in all eukaryotic organisms. In Saccharomyces cerevisiae, it is the second messenger in the Ras/PKA pathway which regulates nutrient sensing, stress responses, growth, cell cycle progression, morphogenesis, and cell wall biosynthesis. A stochastic model of the pathway has been reported.
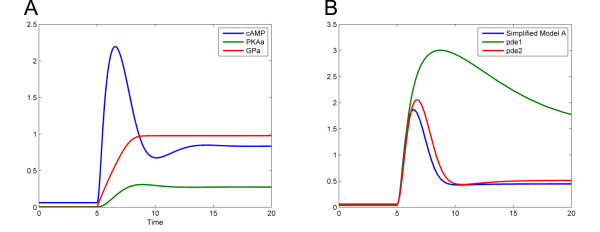
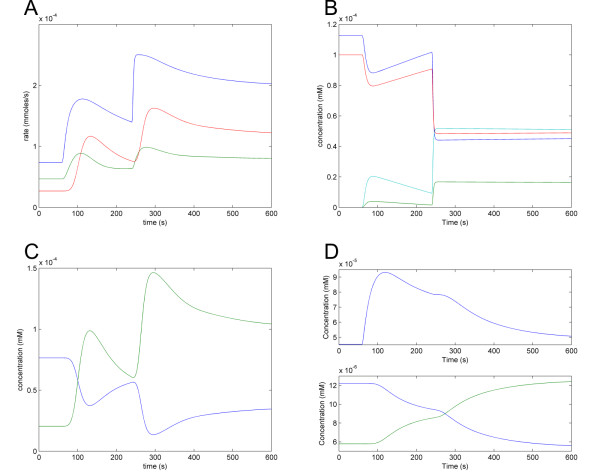
Results: We have created deterministic mathematical models of the PKA module of the pathway, as well as the complete cAMP pathway. First, a simplified conceptual model was created which reproduced the dynamics of changes in cAMP levels in response to glucose addition in wild-type as well as cAMP phosphodiesterase deletion mutants. This model was used to investigate the role of the regulatory Krh proteins that had not been included previously. The Krh-containing conceptual model reproduced very well the experimental evidence supporting the role of Krh as a direct inhibitor of PKA. These results were used to develop the Complete cAMP Model. Upon simulation it illustrated several important features of the yeast cAMP pathway: Pde1p is more important than is Pde2p for controlling the cAMP levels following glucose pulses; the proportion of active PKA is not directly proportional to the cAMP level, allowing PKA to exert negative feedback; negative feedback mechanisms include activating Pde1p and deactivating Ras2 via phosphorylation of Cdc25. The Complete cAMP model is easier to simulate, and although significantly simpler than the existing stochastic one, it recreates cAMP levels and patterns of changes in cAMP levels observed experimentally in vivo in response to glucose addition in wild-type as well as representative mutant strains such as pde1Delta, pde2Delta, cyr1Delta, and others. The complete model is made available in SBML format.
Conclusion: We suggest that the lower number of reactions and parameters makes these models suitable for integrating them with models of metabolism or of the cell cycle in S. cerevisiae. Similar models could be also useful for studies in the human pathogen Candida albicans as well as other less well-characterized fungal species.
Figures


Similar articles
-
Modeling mutant phenotypes and oscillatory dynamics in the Saccharomyces cerevisiae cAMP-PKA pathway.BMC Syst Biol. 2013 May 17;7:40. doi: 10.1186/1752-0509-7-40. BMC Syst Biol. 2013. PMID: 23680078 Free PMC article.
-
Novel sensing mechanisms and targets for the cAMP-protein kinase A pathway in the yeast Saccharomyces cerevisiae.Mol Microbiol. 1999 Sep;33(5):904-18. doi: 10.1046/j.1365-2958.1999.01538.x. Mol Microbiol. 1999. PMID: 10476026 Review.
-
Activation state of the Ras2 protein and glucose-induced signaling in Saccharomyces cerevisiae.J Biol Chem. 2004 Nov 5;279(45):46715-22. doi: 10.1074/jbc.M405136200. Epub 2004 Aug 31. J Biol Chem. 2004. PMID: 15339905
-
The PDE1-encoded low-affinity phosphodiesterase in the yeast Saccharomyces cerevisiae has a specific function in controlling agonist-induced cAMP signaling.Mol Biol Cell. 1999 Jan;10(1):91-104. doi: 10.1091/mbc.10.1.91. Mol Biol Cell. 1999. PMID: 9880329 Free PMC article.
-
Fermentable sugars and intracellular acidification as specific activators of the RAS-adenylate cyclase signalling pathway in yeast: the relationship to nutrient-induced cell cycle control.Mol Microbiol. 1991 Jun;5(6):1301-7. doi: 10.1111/j.1365-2958.1991.tb00776.x. Mol Microbiol. 1991. PMID: 1664904 Review.
Cited by
-
A unified computational model for cortical post-synaptic plasticity.Elife. 2020 Jul 30;9:e55714. doi: 10.7554/eLife.55714. Elife. 2020. PMID: 32729828 Free PMC article.
-
Nutritional control of growth and development in yeast.Genetics. 2012 Sep;192(1):73-105. doi: 10.1534/genetics.111.135731. Genetics. 2012. PMID: 22964838 Free PMC article. Review.
-
Structurally robust biological networks.BMC Syst Biol. 2011 May 17;5:74. doi: 10.1186/1752-0509-5-74. BMC Syst Biol. 2011. PMID: 21586168 Free PMC article.
-
Modeling mutant phenotypes and oscillatory dynamics in the Saccharomyces cerevisiae cAMP-PKA pathway.BMC Syst Biol. 2013 May 17;7:40. doi: 10.1186/1752-0509-7-40. BMC Syst Biol. 2013. PMID: 23680078 Free PMC article.
-
Toward a multiscale description of microvascular flow regulation: o(2)-dependent release of ATP from human erythrocytes and the distribution of ATP in capillary networks.Front Physiol. 2012 Jul 16;3:246. doi: 10.3389/fphys.2012.00246. eCollection 2012. Front Physiol. 2012. PMID: 22934004 Free PMC article.
References
-
- Portela P, Howell S, Moreno S, Rossi S. In vivo and in vitro phosphorylation of two isoforms of yeast pyruvate kinase by protein kinase A. J Biol Chem. 2002;277:30477–30487. - PubMed
-
- Longo VD. he Ras and Sch9 pathways regulate stress resistance and longevity. Exp Gerontol. 2003;38:807–811. - PubMed
-
- Park J, Grant CM, Dawes IW. The high-affinity cAMP phosphodiesterase of Saccharomyces cerevisiae is the major determinant of cAMP levels in stationary phase: involvement of different branches of the Ras-cyclic AMP pathway in stress responses. Biochem Biophys Res Commun. 2005;327:311–319. - PubMed
-
- Pedruzzi I, Dubouloz F, Cameroni E, Wanke V, Roosen J, Winderickx J, De Virgilio C. TOR and PKA signaling pathways converge on the protein kinase Rim15 to control entry into G0. Mol Cell. 2003;12:1607–1613. - PubMed
Publication types
MeSH terms
Substances
Grants and funding
LinkOut - more resources
Full Text Sources
Molecular Biology Databases
Research Materials
