. 2009 Jul 16;63(1):27-39.
doi: 10.1016/j.neuron.2009.06.014.

Remote control of neuronal activity in transgenic mice expressing evolved G protein-coupled receptors

Affiliations

Remote control of neuronal activity in transgenic mice expressing evolved G protein-coupled receptors

Georgia M Alexander et al. Neuron. .

Abstract

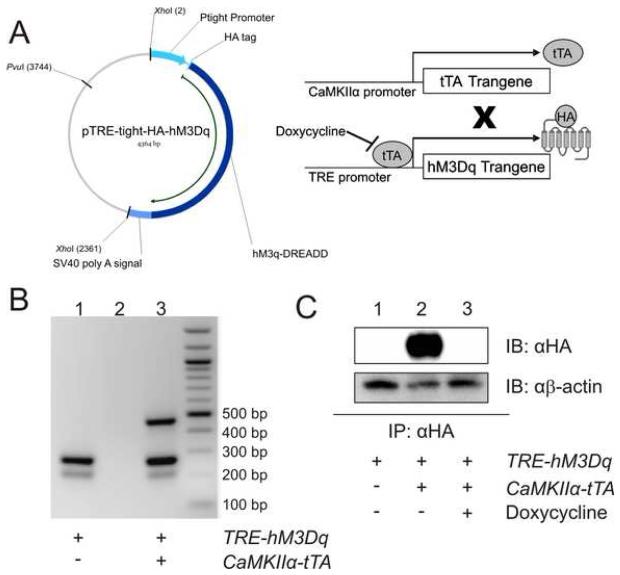
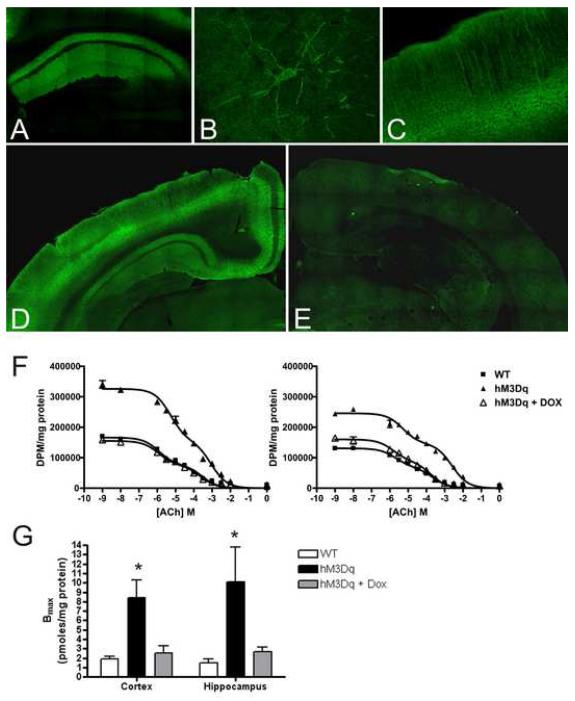
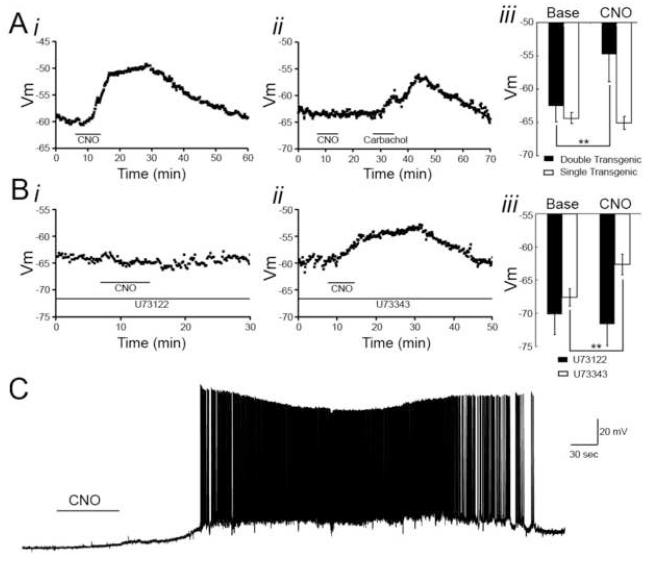
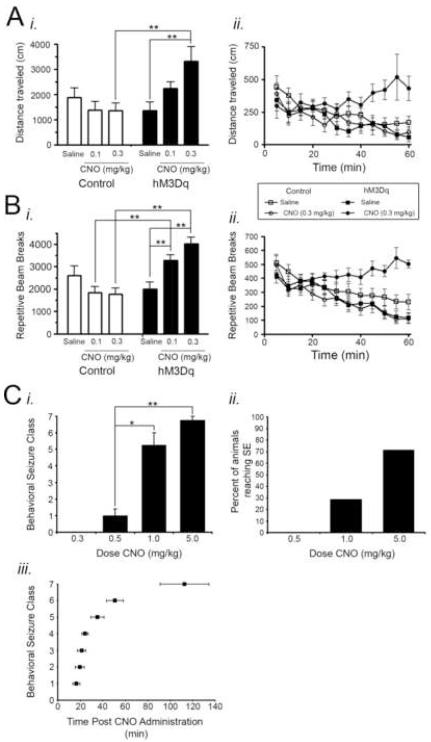
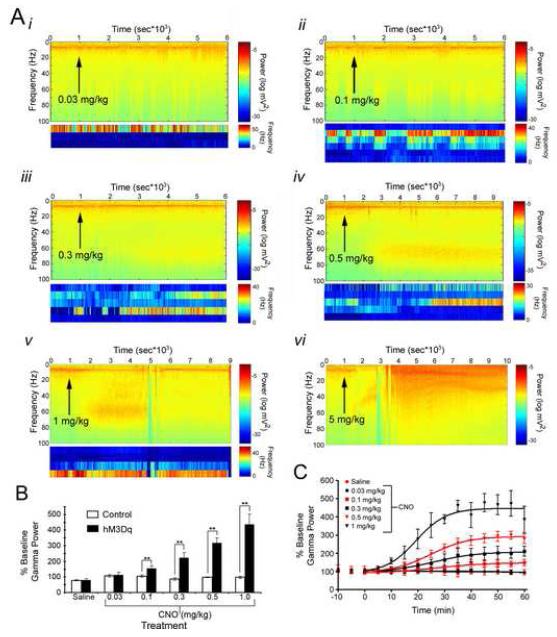
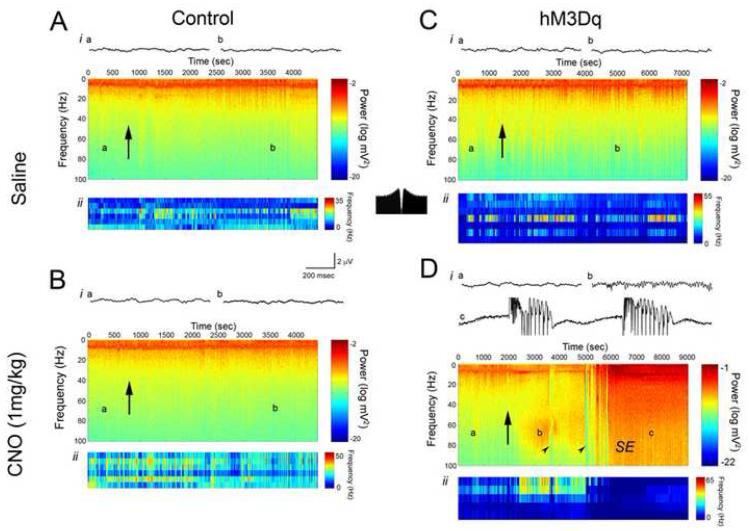
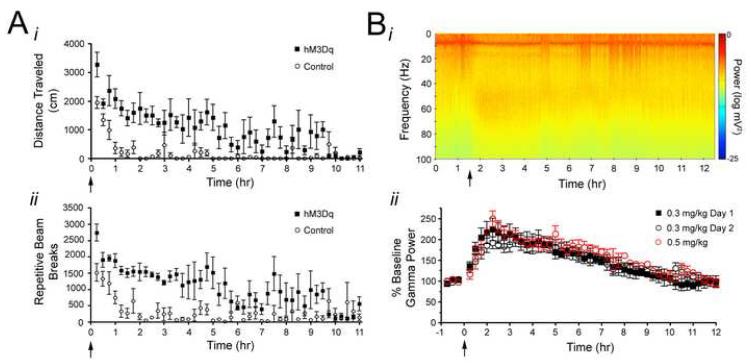
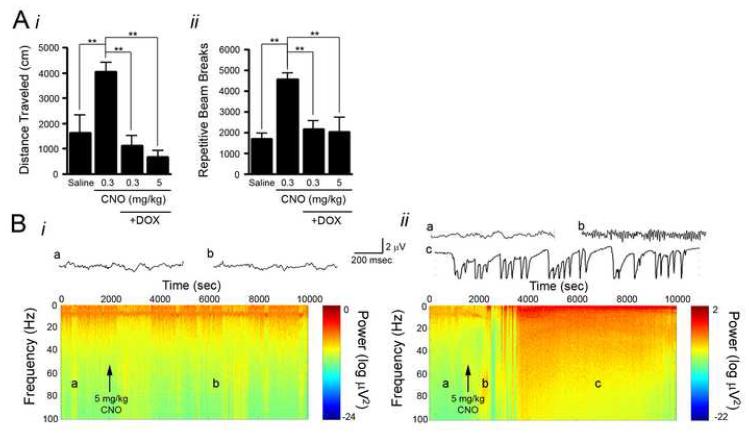
Examining the behavioral consequences of selective CNS neuronal activation is a powerful tool for elucidating mammalian brain function in health and disease. Newly developed genetic, pharmacological, and optical tools allow activation of neurons with exquisite spatiotemporal resolution; however, the inaccessibility to light of widely distributed neuronal populations and the invasiveness required for activation by light or infused ligands limit the utility of these methods. To overcome these barriers, we created transgenic mice expressing an evolved G protein-coupled receptor (hM3Dq) selectively activated by the pharmacologically inert, orally bioavailable drug clozapine-N-oxide (CNO). Here, we expressed hM3Dq in forebrain principal neurons. Local field potential and single-neuron recordings revealed that peripheral administration of CNO activated hippocampal neurons selectively in hM3Dq-expressing mice. Behavioral correlates of neuronal activation included increased locomotion, stereotypy, and limbic seizures. These results demonstrate a powerful chemical-genetic tool for remotely controlling the activity of discrete populations of neurons in vivo.


Figures

Figure 1
Figure 1. Generation of transgenic mice with inducible expression of HA-hM3Dq
A) Pronuclear injection of murine oocytes with the 2.36 kb XhoI restriction digest fragment containing HA-hM3Dq downstream of the Ptight TRE promoter produced a tet-responsive mouse line. When crossed with a CaMKIIα-tTA tet-driver line, tTA protein, produced TRE promoter to activate transcription of HA-hM3Dq; tTA binding to TRE is inhibited by doxycycline. B) Ethidium bromide-stained agarose gel of DNA amplified from tail clips of a single-transgenic (TRE-hM3Dq) mouse (Lane 1), water (Lane 2), and a double-transgenic mouse (Lane 3) reveals presence of CaMKIIα-tTA transgene (450 bp), TRE-hM3Dq transgene (250 bp), and murine genomic DNA control band (200 bp). C) Immunoprecipitation followed by immunoblot does not detect any transgene in single-transgenic mice (TRE-hM3Dq transgene only, Lane 1) or double transgenic (hM3Dq) mice maintained on 200 mg/kg doxycycline (Lane 3), in contrast to hM3Dq mice maintained on normal chow in which HA protein is detectable (Lane 2). β-actin was detected as a loading control. Mouse brains (with cerebellum removed) were homogenized and the membrane-containing fraction was isolated through differential centrifugation. HA-affinity matrix immunoprecipitated HA-tagged proteins which were then separated by SDS-PAGE and detected by Western blot with anti-HA antibody.
Figure 2
Figure 2. Receptor expression and localization in transgenic mouse brains
A-E) Immunohistochemistry for HA-tagged protein in coronal sections from hM3Dq mouse brain; HA immunoreactivity localizes to the CA1 region of the hippocampus (A) where staining is specifically observed in the apical and basal processes of pyramidal neurons (B). In the cortex (C), immunoreactivity is detected in apical dendrites. HA immunoreactivity is present in mutant mice fed normal chow (D) but not in mice maintained on 200 mg/kg doxycycline (E). F) [3H]QNB binding to cortical (left panel) and hippocampal (right panel) mouse brain membranes was determined by radioligand competition-binding assays. Competition curves depict data from one representative animal of each group. Data were fit simultaneously by non-linear regression. G) Mice expressing hM3Dq protein have a higher Bmax of [3H]QNB binding than wild-type mice or hM3Dq mice on doxycycline. *p < 0.05 by F test.
Figure 3
Figure 3. CNO effects on CA1 pyramidal neurons recorded in vitro
Acute hippocampal slices were isolated from hM3Dq and control animals, and CA1 pyramidal cells were recorded from in the whole-cell configuration. Cells were held at resting membrane potential in the presence (A-B) or absence (C) of TTX, and CNO was bath applied. A, Bath application of CNO (500 nM) depolarized CA1 pyramidal cells from hM3Dq animals (i), but CNO did not affect resting membrane potential of CA1 pyramidal cells from control animals. However, bath application of carbachol (5 μM) did depolarize CA1 pyramidal cells from control animals (ii). Aiii, Population data from hM3Dq and control animals showing the mean resting membrane potential of CA1 pyramidal cells before and in the presence of CNO [500 nM for hM3Dq (n=7 cells from 5 animals) and 1 μM for control animals (n=7 cells from 5 animals)]. B, In the presence of an active PLC inhibitor (U73122, 10μM) the CNO-induced depolarization of hM3Dq CA1 pyramidal neurons was blocked (i), but in the presence of an inactive analog (U73343, 10μM) CNO was capable of depolarizing hM3Dq CA1 pyramidal neurons (ii). Biii, Population data showing change in resting membrane potential of hM3Dq CA1 pyramidal neurons induced by CNO (500nM) in the presence of U73122 (n=6 cells from 4 animals) or U73343 (n=4 cells from 4 animals). C, Bath application of CNO (500 nM) to hippocampal slices isolated from hM3Dq animals in the absence of TTX resulted in increased firing frequency and recurrent bursting.
Figure 4
Figure 4. Behavioral consequences of CNO administration
A-B, Effect of CNO administration on locomotor behavior in control and hM3Dq mice (n=10 hM3Dq and 14 control mice). CNO increased total locomotor activity (A) and repetitive beam breaks (B) in a dose-dependent (Ai, Bi) and time-dependent (Aii, Bii) manner in hM3Dq mice relative to control animals. For Aii and Bii, CNO was administered at time 0 following a 20 minute habituation period in the locomotor chamber. C, Behavioral seizure classes evoked by CNO administration (n=7 hM3Dq animals). All data presented here were measured during the 3 hours following CNO administration when SE did not occur and during the 3 hours following SE onset when SE did occur. Ci, Maximum behavioral seizure class elicited by various doses of CNO. No seizures were elicited by doses less than 0.5 mg/kg CNO. Cii, Percent of animals in which SE occurred at various doses of CNO. SE did not result from doses less than 1 mg/kg. Ciii, Latency from CNO administration to first occurrence of each behavioral seizure class for animals administered 5 mg/kg CNO. * represents p<0.05; ** represents p<0.01.
Figure 5
Figure 5. CNO dose-dependently increase neuronal activity and gamma power in hM3Dq mice
A, CNO administration to hM3Dq mice evoked dose-dependent increases in hippocampal neuronal activity (i-vi), as seen by increased power in the gamma frequency band of the LFP and associated increased firing rate of presumed interneurons. Spectrograms show the power of all frequencies up to 100 Hz over the course of the recording session, with warmer colors representing greater power. Plots below spectrograms represent single unit firing rate of presumed interneurons, and each row corresponds to a single neuron. Here, warmer colors represent greater firing frequency. Classification of neurons as interneurons was based on firing frequency and pattern of firing. Arrows indicate the time at which CNO was administered s.c. at the dose indicated above each spectrogram. In A vi-vi, arrowheads indicate occurrence of isolated electrographic seizures, and SE represents onset of uninterrupted electrographic seizure activity. B, Peak power in the gamma frequency range measured from the LFP before and after administration of various doses of CNO displayed as percent of baseline gamma power (n=4 hM3Dq and 11 control animals). C, Timecourse of peak LFP gamma power change from baseline following administration of various doses of CNO. CNO was given at 0 minutes. ** represents p<0.01.
Figure 6
Figure 6. Local field potential and single unit recordings from hippocampus of control and hM3Dq animals administered either saline or 1 mg/kg CNO subcutaneously
For each of A-D, i represent local field potential recordings. Spectrograms show the power of all frequencies up to 100 Hz over the course of the recording session, with warmer colors representing greater power. Letters on each spectrogram correspond to the example LFP epochs shown above each spectrogram. Arrows represent the time at which either saline or CNO was administered. ii in each of A-D show the firing frequency of individual putative interneurons recorded in hippocampus. Here, warmer colors represent greater firing frequency. Classification of neurons as interneurons was based on firing frequency and pattern of firing. As shown in the inset autocorrelogram between A and D, interneurons tended to fire tonically, as previously described (Henze et al., 2002). In Di, CNO (5 m/kg) elicited increased power in the gamma frequency range (b) before the onset of seizures (c). Arrowheads in D indicate occurrence of isolated electrographic seizures, and SE represents onset of uninterrupted electrographic seizure activity.
Figure 7
Figure 7. Behavioral and in vivo electrophysiological timecourse of CNO effects in hM3Dq animals
A, Timecourse of CNO effects on locomotor activity, as measured by total distance traveled (i) and repeated beam breaks (ii), showing the latency to recovery of elevated locomotor activity following administration of 0.3 mg/kg CNO, which was administered at time 0 (n=4 littermate pairs). B, Timecourse of CNO effects on gamma power measured from the hippocampal LFP showing the latency to recovery of gamma power to baseline levels. Bi, Representative spectrogram of LFP from hM3Dq animal administered 0.3 mg/kg CNO at time 1.5 hr. ii, Population data demonstrating timecourse of acutely administered CNO on gamma power and gamma power response to two injections of CNO administered 24 hours apart from one another. The timecourse of onset and offset of CNO effects, as measured by changes in gamma power, was measured during an acute administration of either 0.3 mg/kg (closed black squares; n=3 hM3Dq animals) or 0.5 mg/kg (open red circle; n=2 hM3Dq animals) CNO to determine dose-dependence of onset and offset kinetics. Twenty four hours following the acute administration of 0.3 mg/kg CNO (Day 1; closed black squares), a second injection of 0.3 mg/kg CNO was administered to the same animals and gamma power response was monitored (Day 2; open black circles) for the purpose of assessing desensitization of the hM3Dq receptor.
Figure 8
Figure 8. Doxycycline treatment of hM3Dq animals prevents CNO induced behavioral and electrophysiological changes
A, CNO administration to hM3Dq animals not exposed to doxycycline produced increased locomotor activity as measured by total distance traveled (i) and repetitive beam breaks (ii). However, four weeks of doxycycline exposure inhibited CNO-induced changes in locomotor activity (n=5 hM3Dq mice). Bi, Four weeks of doxycycline exposure inhibited CNO (5 mg/kg) induced changes in the LFP. No increase in gamma power was elicited and no seizures resulted from CNO administration. Bii, Following 4 weeks of doxycycline exposure, animals were taken off doxycycline for 4 weeks and challenged with CNO (5 mg/kg) again. At this time, CNO elicited increased power in the gamma frequency range (b) and subsequent SE (c).

References

    1. Airan RD, Thompson KR, Fenno LE, Bernstein H, Deisseroth K. Temporally precise in vivo control of intracellular signalling. Nature. 2009;458:1025–1029. - PubMed
    1. Arenkiel BR, Klein ME, Davison IG, Katz LC, Ehlers MD. Genetic control of neuronal activity in mice conditionally expressing TRPV1. Nat Methods. 2008;5:299–302. - PMC - PubMed
    1. Armbruster BN, Li X, Pausch MH, Herlitze S, Roth BL. Evolving the lock to fit the key to create a family of G protein-coupled receptors potently activated by an inert ligand. Proc Natl Acad Sci U S A. 2007;104:5163–5168. - PMC - PubMed
    1. Bender D, Holschbach M, Stocklin G. Synthesis of n.c.a. carbon-11 labelled clozapine and its major metabolite clozapine-N-oxide and comparison of their biodistribution in mice. Nucl Med Biol. 1994;21:921–925. - PubMed
    1. Bartos M, Vida I, Jonas P. Synaptic mechanisms of synchronized gamma oscillations in inhibitory interneuron networks. Nat Rev Neurosci. 2007;8:45–56. - PubMed

Publication types

MeSH terms