. 2009 Sep 15;333(2):348-58.
doi: 10.1016/j.ydbio.2009.07.003. Epub 2009 Jul 14.

The transcriptional cofactor Lbh regulates angiogenesis and endochondral bone formation during fetal bone development

Affiliations

The transcriptional cofactor Lbh regulates angiogenesis and endochondral bone formation during fetal bone development

K L Conen et al. Dev Biol. .

Abstract

Lbh is thought to act as a transcriptional cofactor and is highly conserved among species. Here we show that Lbh is expressed in chondrocytes, cells of the perichondrium, and the primary spongiosa in fetal growth plates of mice and chickens. Lbh overexpression in chick wings, using the RCAS-retroviral vector strategy, results in shortened skeletal elements and delayed hypertrophic chondrocyte maturation and bone formation. Additionally, osteoclast and endothelial cell invasion are delayed in the Lbh-overexpressing bones. Finally, we find a dramatic suppression of Runx2 and VEGF mRNAs in chondrocytes and osteoblasts that overexpress Lbh. Strikingly, this abnormal bone development in infected limbs can be rescued by concurrent overexpression of Runx2. These results suggest that during endochondral bone formation, Lbh may negatively regulate vascular invasion and formation of the early ossification center at least in part by interfering with Runx2 and/or VEGF expression.


Figures
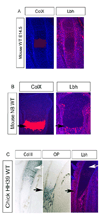
Figure 1
Figure 1
Lbh expression in the fetal growth plate of mouse and chicken. (A) In WT mouse growth plates at E14.5 Lbh is highly expressed in round and flat proliferating chondrocytes while there is no Lbh expression in early hypertrophic chondrocytes (compared to collagen X mRNA (ColX;Col10a) expression). Lbh is also expressed in cells of the perichondrium and in the surrounding soft tissues. (B) ISH for Lbh in WT NB mice, showing that Lbh is expressed in round, flat and late hypertrophic chondrocytes, cells of the POC, the perichondrium and in the bone surrounding tissues. (black arrows indicate identical positions near lower end of region of collagen X mRNA expression on serial sections of the same bone.) (C) ISH for Lbh in WT chickens at stage HH39 (E11). Lbh is expressed in round (white arrows, compare to col II mRNA expression on a serial section of the same bone), flat, and late hypertrophic chondrocytes (black arrows, compare to OP mRNA expression on a serial section of the same bone), cells of the POC, the perichondrium and in the tissues surrounding bone.
Figure 2
Figure 2
RCAS-Lbh overexpression delays chondrocyte hypertrophy, vascular invasion and the formation of the POC. (A) Skeletal preparations stained with alcian blue and alizarin red at HH39 show a shortened RCAS-Lbh infected wing. Additionally, the zone of mineralization appears shorter and occurs in the first digit of the control wing while it is still missing in the Lbh overexpressing first digit (arrowheads). Quantification of the humerus, ulna and carpometacarpal length demonstrates a significant reduction of the infected bones. Values are expressed as means ±SEM. *P<0.01. (B) (a+b) H&E staining at stage HH33 (ulnae, u) shows a delay in hypertrophic chondrocytes of infected wings (white arrowhead points to hypertrophic chondrocytes). (c–h) H&E staining between HH37 and HH39 (carpometacarpal, CMC) shows a delay of vascular invasion and bone formation of infected wings. (C) (a–d) H&E staining between HH39 and HH40 shows a delay of vascular invasion and bone formation of infected wings. (e+f) This phenotype catches up over time (HH42).
Figure 3
Figure 3
Molecular analysis of RCAS-Lbh overexpressing bones. (A) (a–d) ISH analyses for col II and col X mRNA at HH33. The pattern of col II transcripts is similar in both control and RCAS-Lbh overexpressing bones whereas col X expression is delayed in RCAS-Lbh overexpressing bones. (c`+d`) higher magnifications of c and d. (e–h) ISH analyzes for genes expressed in proliferating chondrocytes ((e, f) coll II mRNA) and prehypertrophic chondrocytes, ((g, h) Ihh mRNA) at HH36 revealed a comparable mRNA expression pattern in both control and RCAS-Lbh overexpressing CMC. (i+j) ISH for col X at HH36 CMC shows a similar expression pattern in control and Lbh-overexpressing bones, reflecting a catch up of the phenotype seen earlier. (k+l) ISH for col I mRNA expression at HH36 shows col I expression in control CMC in the perichondrial region of the developing bones, while Lbh-overexpressing CMC shows weak expression in the perichondrial area. (m+n) ISH for OP mRNA appeared with a weaker and shorter expression area in Lbh-overexpressing bones compared to the control bones. (B) QRT-PCR analyses of genes related to osteoblast and late hypertrophic chondrocyte differentiation in HH39 old control (gray bars) and RCAS-Lbh (white bars) overexpressing wings (n=10). Expression of OC, OP, Col I and MMP13 mRNA is decreased in RCAS-Lbh overexpressing bones as compared to the control. Values are expressed as means ±SEM and represent the relative mRNA expression level normalized to GAPDH expression level. *p<0.01.
Figure 4
Figure 4
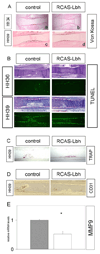
Effect of RCAS-Lbh overexpression on bone mineralization, cartilage resorption and osteoclast and endothelial cell invasion. (A) (a+b) Von Kossa (v.K.) staining of the CMC at HH36 as well as HH39 (c+d) illustrating impaired bone collar mineralization in RCAS-Lbh overexpressing bones compared to control bones. (B) TUNEL staining of CMC of HH36 and HH39 old animals. H&E stained serial sections are included to identify the regions of cellular apoptosis. While control CMC show apoptotic cells in the region of vascular invasion, invasion itself as well as apoptosis are delayed in the RCAS-Lbh overexpressing CMC. (C) TRAP stained CMC at HH39 reveal TRAP positive cells in the centers of the midshafts in control bones, whereas in the RCAS-Lbh overexpressing bones, the TRAP positive cells occur in the region of the perichondrium. (D) IHC for CD31 at HH39 CMC. Like in the TRAP staining, brown CD31 staining is more intense and occurs in the center of the bones’ midshafts where vascular invasion occurs in the control CMC. The Lbh overexpressing bone shows some single CD31-stained brown cells in the perichondrial region. (E) QRT-PCR analyzes of the MMP9 gene related to cartilage resorption and osteoclast invasion in HH39 old control (gray bars) and RCAS-Lbh (white bars) overexpressing wings (n=10). Expression of MMP9 mRNA is decreased in RCAS-Lbh overexpressing bones as compared to control bones. Values are expressed as means ±SEM and represent the relative mRNA expression level determined as the ratio of the respective signal to the signal obtained for the chicken GAPDH gene. *p<0.02.
Figure 5
Figure 5
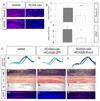
RCAS-Lbh overexpression represses Runx2 and VEGF mRNA which can be rescued by co-overexpressing Lbh and Runx2 (A) ISH at HH36 (CMC) shows a dramatic repression of Runx2 and VEGF transcripts. (B) QRT-PCR analyses of Runx2 and VEGF mRNA expression in stage HH39 old control (gray bars) and RCAS-Lbh (white bars) overexpressing wings (n=10). Expression of both Runx2 and VEGF mRNA is decreased in RCAS-Lbh overexpressing bones as compared to control bones. Values are expressed as means ±SEM and represent the relative mRNA expression level determined as the ratio of the respective signal to the signal obtained for the chicken GAPDH gene. *p<0.02, **p<0.05. (C) Co-overexpression of RCAS(A)-Lbh (Lbh) and RCAS(B)-Runx2 (Runx2) or Lbh and RCAS-(B)-GFP (GFP) were performed at stage HH20 and reincubated until HH39. Serial sections from CMC are shown. (a–c) In Lbh-Runx2 double infected wings skeletal preparations show a rescue of the shortened skeletal elements seen in the Lbh-GFP infected wing in comparison to the control wing. (d–i) In Lbh-Runx2 double infected wings H&E and von Kossa staining shows a rescue of the delayed vascular invasion and bone collar formation seen in the Lbh-GFP infected wing in comparison to the control wing.(j–o) In Lbh-Runx2 double infected wings, in ISH for OP and VEGF shows a rescue of the dramatic downregulation of both markers in the Lbh-GFP infected versus the control wing.
Figure 6
Figure 6
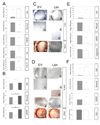
Forced Lbh expression in vitro in avian (A+B) and murine (C–F) cell lines. (A) Lbh overexpression in primary cultures of chicken chondrocytes decreases mRNA levels of Runx2, VEGF, OP and col X. Upper sternal chondrocytes were infected with RCAS(B)-Lbh retrovirus (white bar) or RCAS(B)-empty vector (EV) (gray bar) and cultured for 7 d. Gene expression was assayed by QRT-PCR. Values are expressed as means ±SEM and represent the relative mRNA expression level determined as the ratio of the respective signal to the signal obtained for the chicken GAPDH gene. *p<0.01, **p<0.001. (B) Lbh and Runx2 co-overexpression in upper sternal chondrocytes can rescue the decreased levels of Runx2 and VEGF mRNA. Upper sternal chondrocytes were infected with RCAS(B)-EV (gray bar), RCAS(B)-Lbh (white bar) or RCAS(B)-Lbh/RCAS(A)-Runx2 (black bar) retrovirus and cultured for 7 d. Gene expression was assayed by QRT-PCR. Values are expressed as means ±SEM and represent the relative mRNA expression level determined as the ratio of the respective signal to the signal obtained for the chicken GAPDH gene. *p<0.02, **p<0.01. (C) Forced Lbh expression in ATDC5 cells delays alkaline phosphatase (AP) expression and formation of mineralization nodules. ATDC5 cells were stably transfected with pcDNA3.1 empty vector (EV) or pcDNA3.1-Lbh vector (Lbh). (a–d) AP staining at 14d. (d`) phase contrast picture of d. (e+f) Alizarin Red staining at 30d. (D) Forced Lbh expression in MC3T3 cells delays alkaline phosphatase (AP) expression and formation of mineralization nodules. MC3T3 cells were stably transfected with pcDNA3.1 empty vector (EV) or pcDNA3.1-Lbh vector (Lbh). (a–d) AP staining at 14d. (d`) phase contrast picture of d. (e+f) Alizarin Red staining at 14d. (g+h) Alizarin red staining at 30d. (E) Lbh missexpression in ATDC5 cells decreases mRNA levels of Runx2 and VEGF. ATDC5 cells were stably transfected with pcDNA3.1 EV (gray bar) or pcDNA3.1 Lbh (white bar) and cultured for 7 d. Gene expression was assayed by QRT-PCR. Values are expressed as means ±SEM and represent the relative mRNA expression level determined as the ratio of the respective signal to the signal obtained for the mouse β-actin gene. *p<0.01, **p<0.004. (F) Lbh missexpression in MC3T3 cells decreases mRNA levels of Runx2 and VEGF. MC3T3 cells were stably transfected with pcDNA3.1 EV (gray bar) or pcDNA3.1 Lbh (white bar) and cultured for 7 d. Gene expression was assayed by QRT-PCR. Values are expressed as means ±SEM. *p<0.01.

References

    1. Afzal F, Pratap J, Ito K, Ito Y, Stein JL, van Wijnen AJ, Stein GS, Lian JB, Javed A. Smad function and intranuclear targeting share a Runx2 motif required for osteogenic lineage induction and BMP2 responsive transcription. J Cell Physiol. 2005;204:63–72. - PubMed
    1. Bastepe M, Weinstein LS, Ogata N, Kawaguchi H, Juppner H, Kronenberg HM, Chung UI. Stimulatory G protein directly regulates hypertrophic differentiation of growth plate cartilage in vivo. Proc Natl Acad Sci U S A. 2004;101:14794–14799. - PMC - PubMed
    1. Briegel KJ, Baldwin HS, Epstein JA, Joyner AL. Congenital heart disease reminiscent of partial trisomy 2p syndrome in mice transgenic for the transcription factor Lbh. Development. 2005;132:3305–3316. - PubMed
    1. Briegel KJ, Joyner AL. Identification and characterization of Lbh, a novel conserved nuclear protein expressed during early limb and heart development. Dev Biol. 2001;233:291–304. - PubMed
    1. Carlevaro MF, Cermelli S, Cancedda R, Descalzi Cancedda F. Vascular endothelial growth factor (VEGF) in cartilage neovascularization and chondrocyte differentiation: auto-paracrine role during endochondral bone formation. J Cell Sci. 2000;113(Pt 1):59–69. - PubMed

Publication types