. 2009 Nov 15;48(3):515-24.
doi: 10.1016/j.neuroimage.2009.07.006. Epub 2009 Jul 14.

Static and dynamic characteristics of cerebral blood flow during the resting state

Affiliations

Static and dynamic characteristics of cerebral blood flow during the resting state

Qihong Zou et al. Neuroimage. .

Abstract

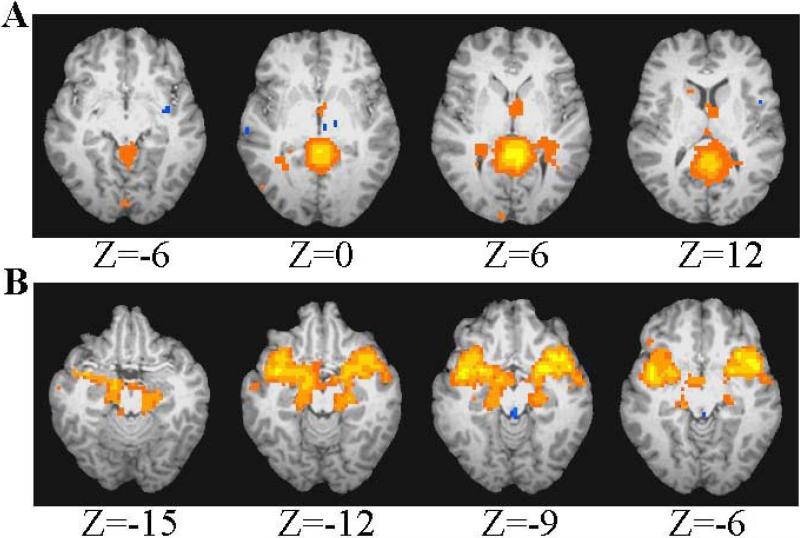
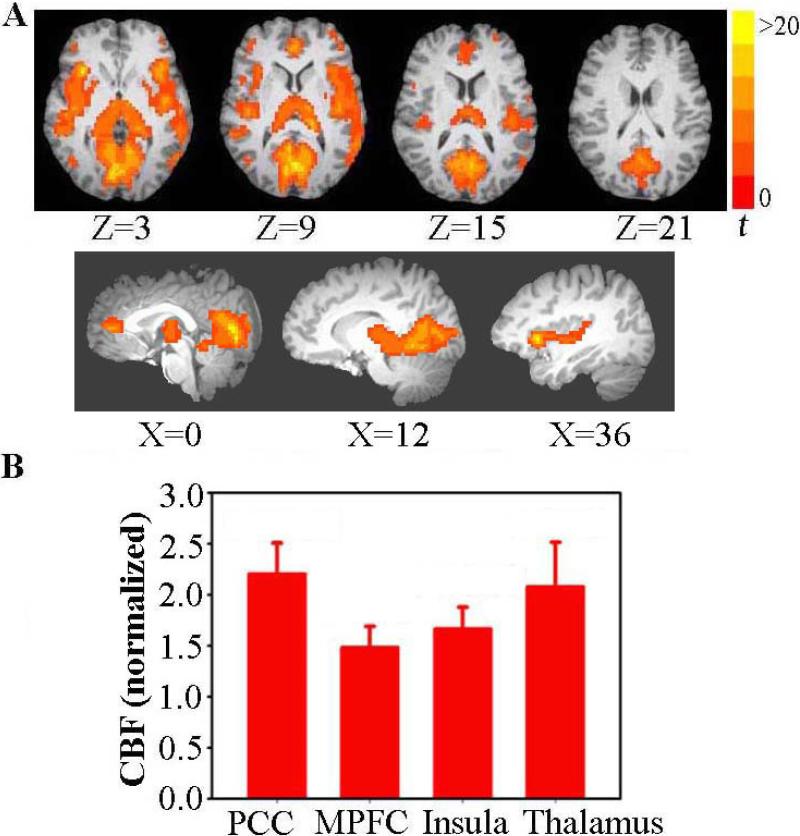
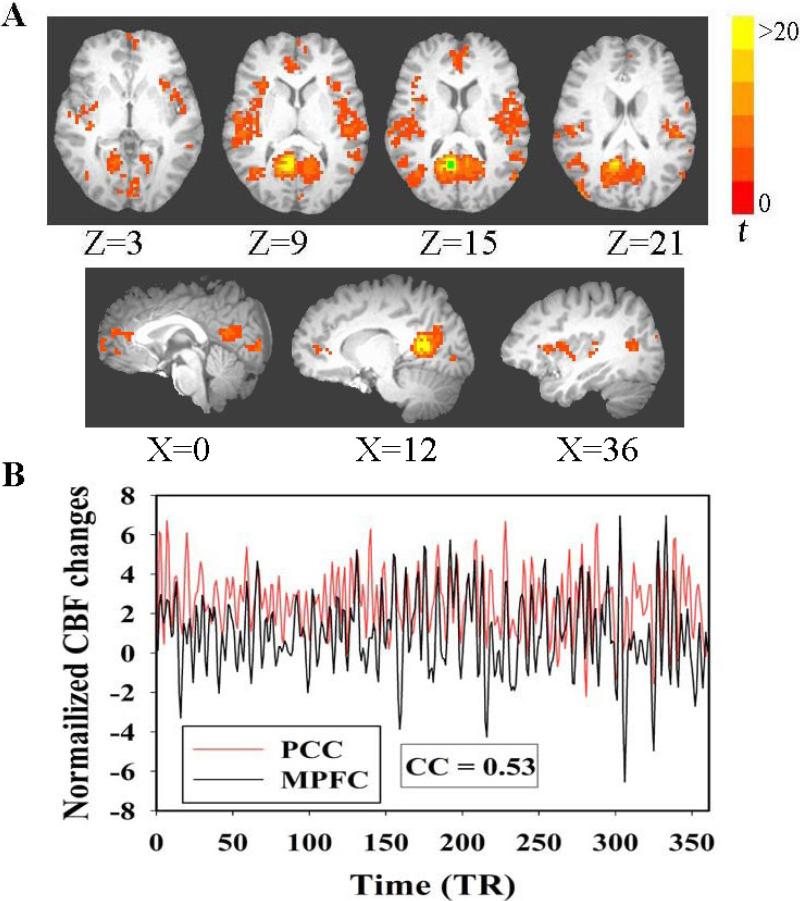
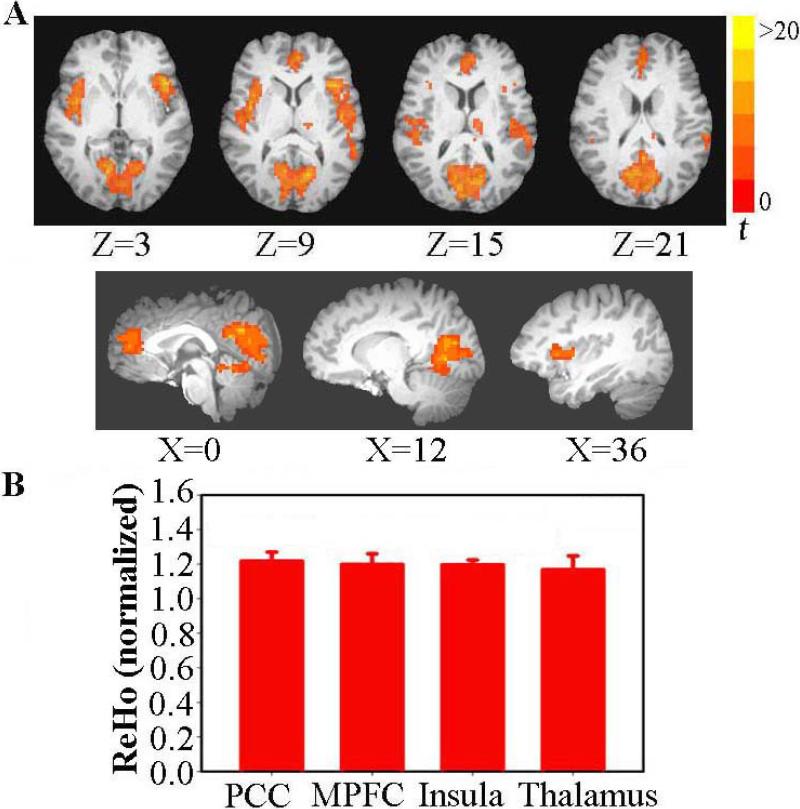
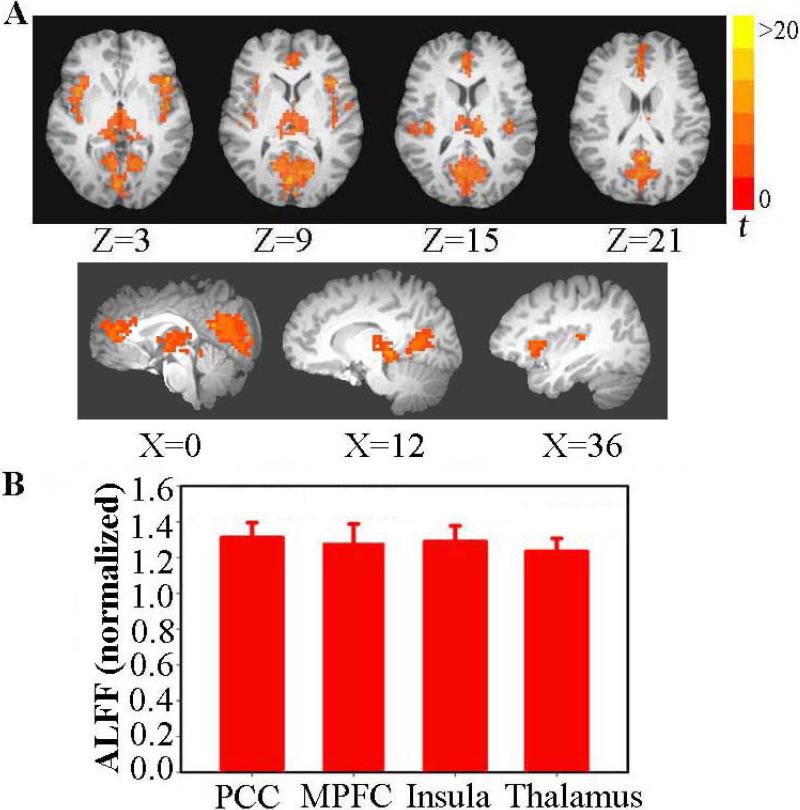
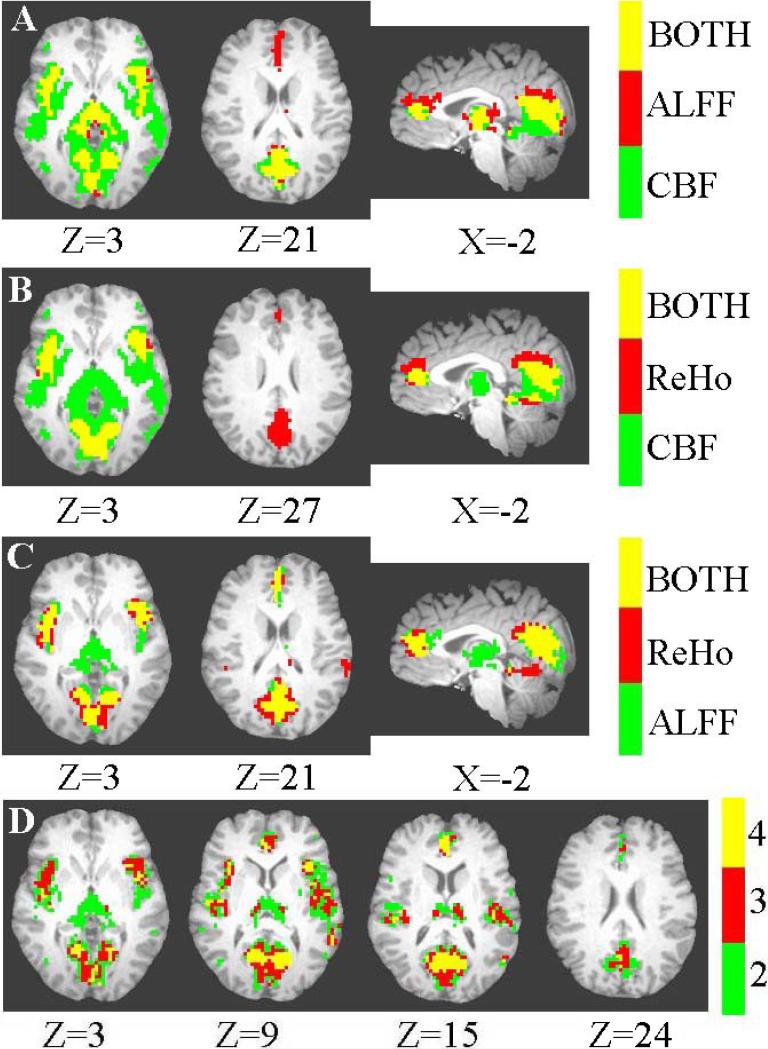
In this study, the static and dynamic characteristics of cerebral blood flow (CBF) in the resting state were investigated using an arterial spin labeling (ASL) perfusion imaging technique. Consistent with previous PET results, static CBF measured by ASL was significantly higher in the posterior cingulate cortex (PCC), thalamus, insula/superior temporal gyrus (STG) and medial prefrontal cortex (MPFC) than the average CBF of the brain. The dynamic measurement of CBF fluctuations showed high correlation (functional connectivity) between components in the default mode network. These brain regions also had high local temporal synchrony and high fluctuation amplitude, as measured by regional homogeneity (ReHo) and amplitude of low-frequency fluctuation (ALFF) analyses. The spatial pattern of the static CBF correlated well with that of the dynamic indices. The high static and dynamic activities in the PCC, MPFC, insula/STG and thalamus suggest that these regions play a vital role in maintaining and facilitating fundamental brain functions.


Figures

Fig. 1
Fig. 1
Spatial patterns of two ICA components that were related to physiological noise estimated from the group of 12 subjects. The numbers below the images refer to the z coordinates in Talairach space. A. cerebrospinal fluid. B. blood vessels.
Fig. 2
Fig. 2
Static characteristics of the CBF signals from the group of 12 subjects. A. The numbers below the images refer to the z coordinates (axial view) or x coordinates (sagittal view) in Talairach space. B. Static CBF in the PCC (t=13.60), MPFC (t=7.98), insula/STG (t=10.58) and thalamus (t=8.49) were significantly higher than the whole brain average (i.e., 1). Data plotted are mean + std.
Fig. 3A
Fig. 3A
Functional connectivity between the CBF changes in the PCC and other brain regions from the group of 12 subjects. The numbers below the images refer to the z coordinates (axial view) or x coordinates (sagittal view) in Talairach space. The green square indicates the location of the PCC seed. B. Normalized time courses retrieved from the PCC and MPFC from a representative subject.
Fig. 4
Fig. 4
ReHo results of dynamic CBF signals from the group of 12 subjects. A. The numbers below the images refer to the z coordinates (axial view) or x coordinates (sagittal view) in Talairach space. B. ReHo values in the PCC (t=14.03), MPFC (t=10.79), insula/STG (t=22.80) and thalamus (t=7.08) were significantly higher than the whole brain average (i.e., 1). Data plotted are mean + std.
Fig. 5
Fig. 5
ALFF results of dynamic CBF signals from the group of 12 subjects. A. The numbers below the images refer to the z coordinates (axial view) or x coordinates (sagittal view) in Talairach space. B. ALFF values within the PCC (t=12.98), MPFC (t=9.08), insula/STG (t=11.43) and thalamus (t=11.09) were significantly higher than the whole brain average (i.e., 1). Data plotted are mean + std.
Fig. 6
Fig. 6
Spatial overlap of static and dynamic characteristics. The numbers below the images refer to the z coordinates (axial view) or x coordinates (sagittal view) in Talairach space. A. Overlap of static CBF and ALFF maps. Regions in yellow showed significance in both static CBF (in green) and ALFF (in red) maps. B. Overlap of static CBF and ReHo maps. Regions in yellow showed significance in both static CBF (in green) and ReHo (in red) maps. C. Overlap of ALFF and ReHo maps. Regions in yellow showed significance in both ALFF (in green) and ReHo (in red) maps. D. Overlap of t-maps of static CBF, PCC-based correlation, ALFF and ReHo. Regions in yellow, red and green indicate that these regions showed significant results in all four, three, and two of t-maps, respectively.

References

    1. Achard S, Salvador R, Whitcher B, Suckling J, Bullmore E. A resilient, low-frequency, small-world human brain functional network with highly connected association cortical hubs. J.Neurosci. 2006;26:63–72. - PMC - PubMed
    1. Aguirre GK, Detre JA, Zarahn E, Alsop DC. Experimental design and the relative sensitivity of BOLD and perfusion fMRI. Neuroimage. 2002;15:488–500. - PubMed
    1. Beckmann CF, DeLuca M, Devlin JT, Smith SM. Investigations into resting-state connectivity using independent component analysis. Philosophical Transactions of the Royal Society B-Biological Sciences. 2005;360:1001–1013. - PMC - PubMed
    1. Beckmann CF, Smith SM. Probabilistic independent component analysis for functional magnetic resonance imaging. IEEE Trans.Med.Imaging. 2004;23:137–152. - PubMed
    1. Biswal B, Hudetz AG, Yetkin FZ, Haughton VM, Hyde JS. Hypercapnia reversibly suppresses low-frequency fluctuations in the human motor cortex during rest using echo-planar MRI. J.Cereb.Blood Flow Metab. 1997a;17:301–308. - PubMed

Publication types

LinkOut - more resources