

Novel diffusion tensor imaging methodology to detect and quantify injured regions and affected brain pathways in traumatic brain injury
- PMID: 19608369
- PMCID: PMC2789859
- DOI: 10.1016/j.mri.2009.05.049
Novel diffusion tensor imaging methodology to detect and quantify injured regions and affected brain pathways in traumatic brain injury
Abstract
Purpose: To develop and apply diffusion tensor imaging (DTI)-based normalization methodology for the detection and quantification of sites of traumatic brain injury (TBI) and the impact of injury along specific brain pathways in (a) individual TBI subjects and (b) a TBI group.
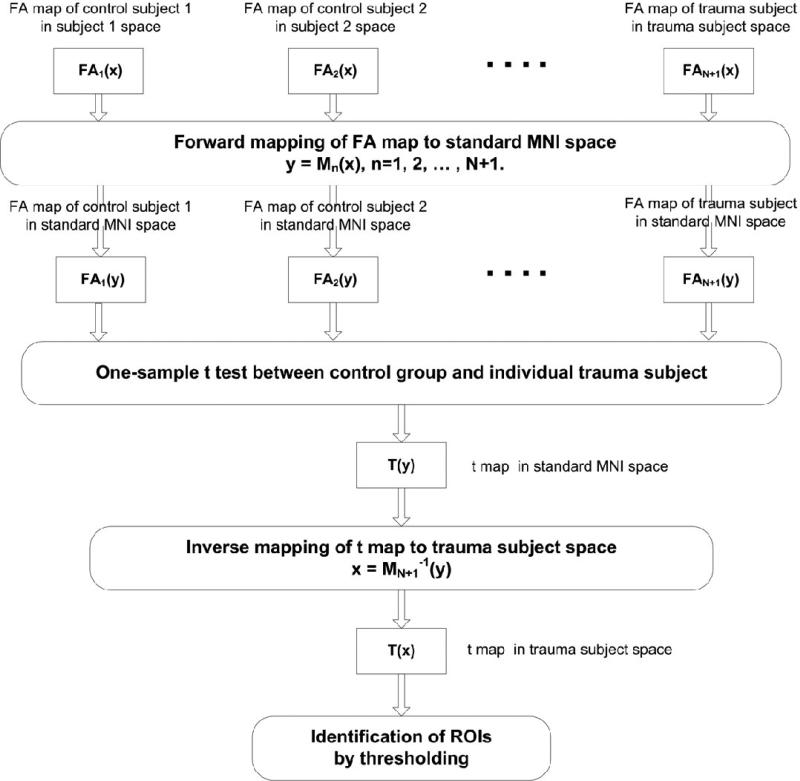
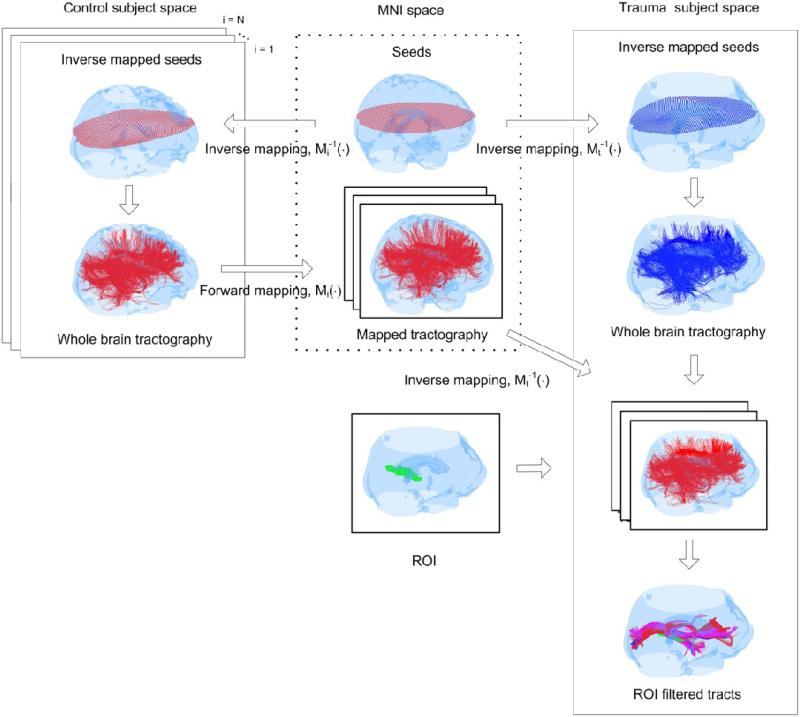
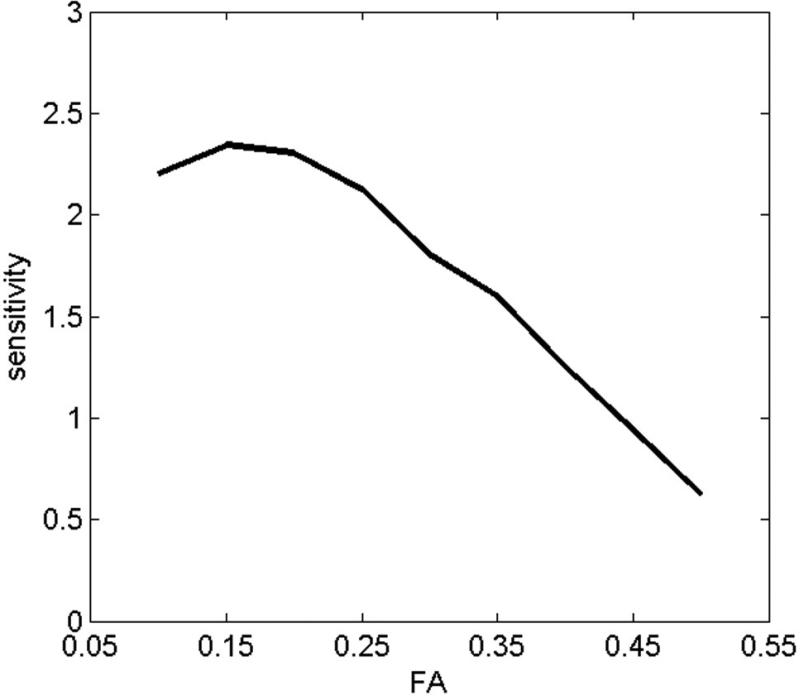
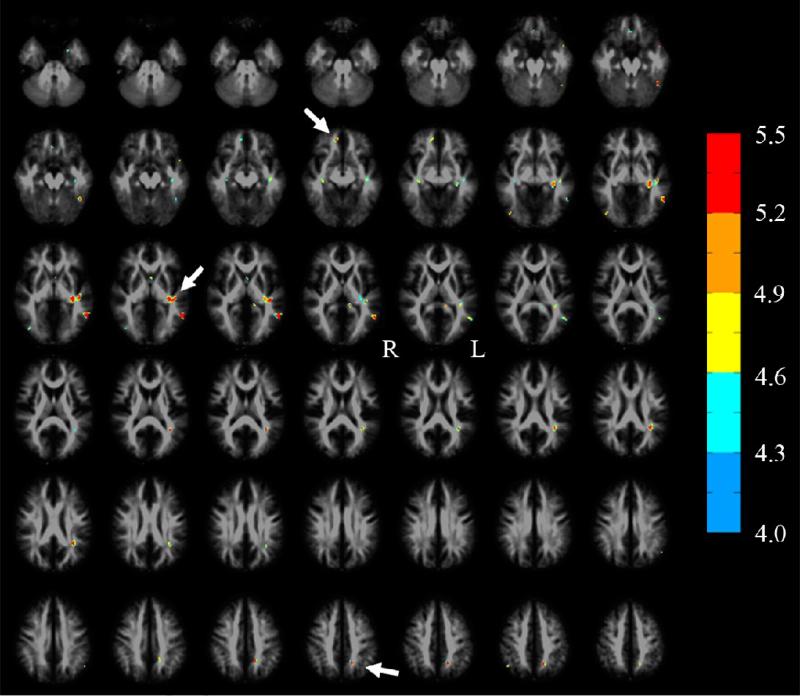
Materials and methods: Normalized DTI tractography was conducted in the native space of 12 TBI and 10 age-matched control subjects using the same number of seeds in each subject, distributed at anatomically equivalent locations. Whole-brain tracts from the control group were mapped onto the head of each TBI subject. Differences in the fractional anisotropy (FA) maps between each TBI subject and the control group were computed in a common space using a t test, transformed back to the individual TBI subject's head space, and thresholded to form regions of interest (ROIs) that were used to sort tracts from the control group and the individual TBI subject. Tract counts for a given ROI in each TBI subject were compared to group mean for the same ROI to quantify the impact of injury along affected pathways. The same procedure was used to compare the TBI group to the control group in a common space.
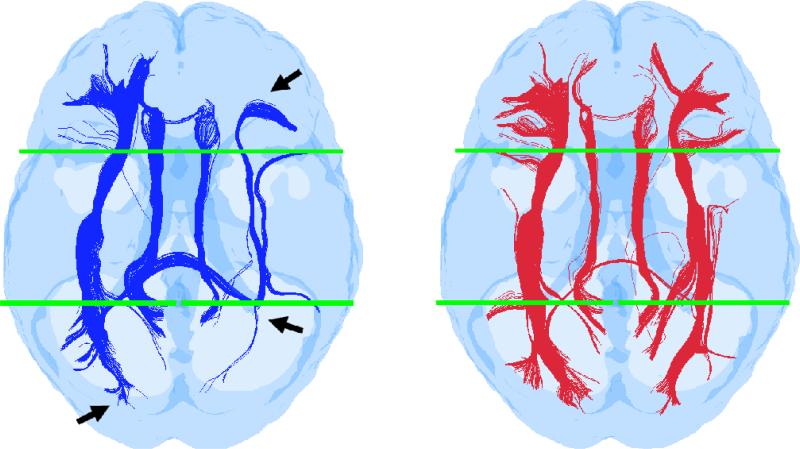
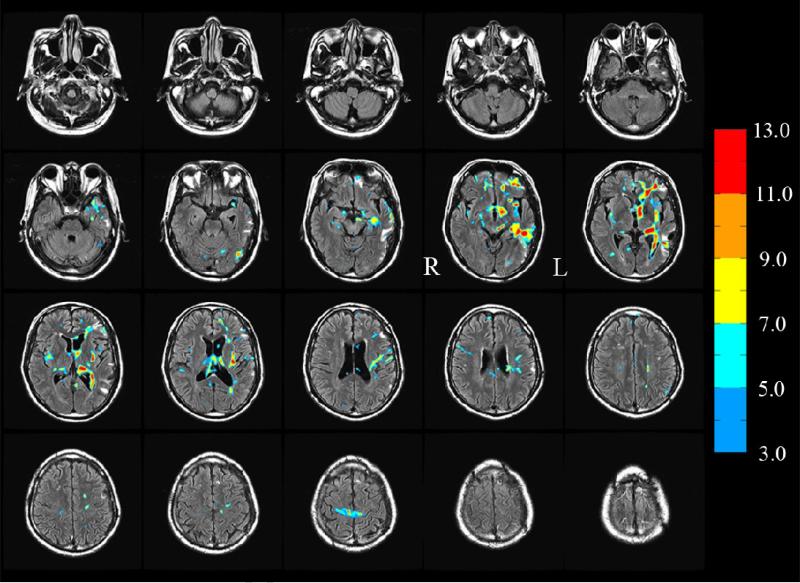
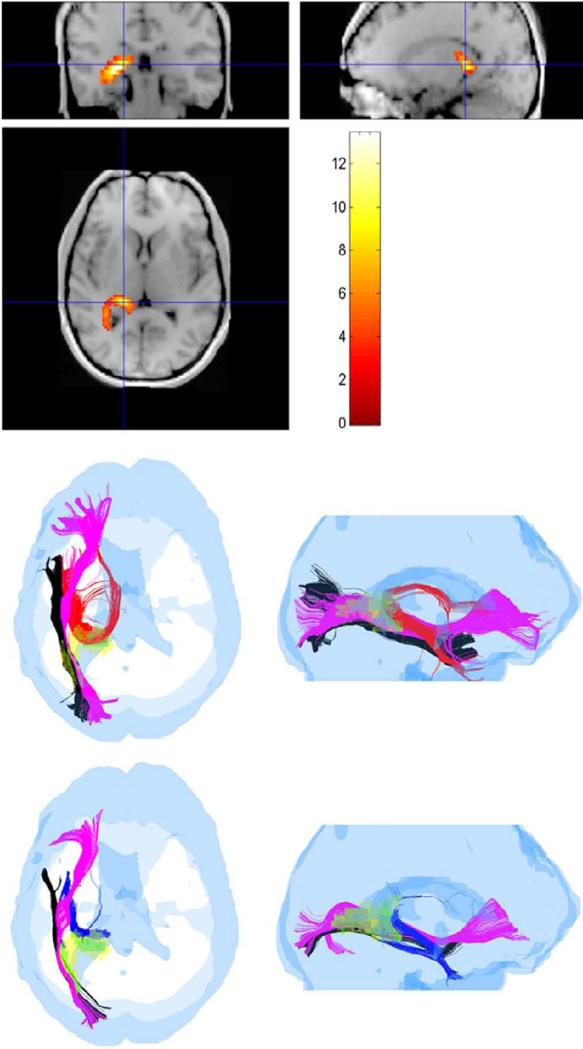
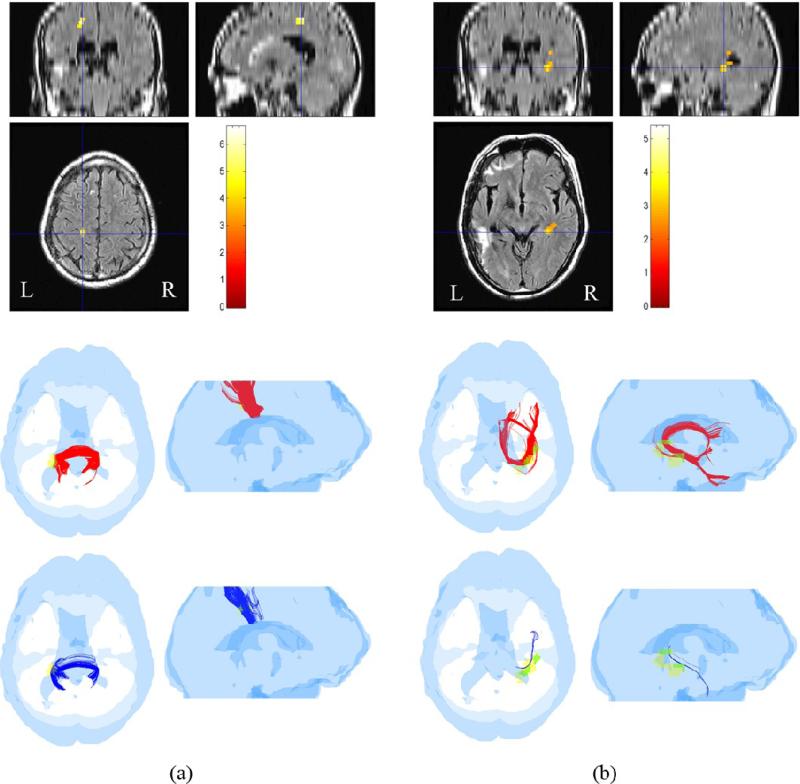
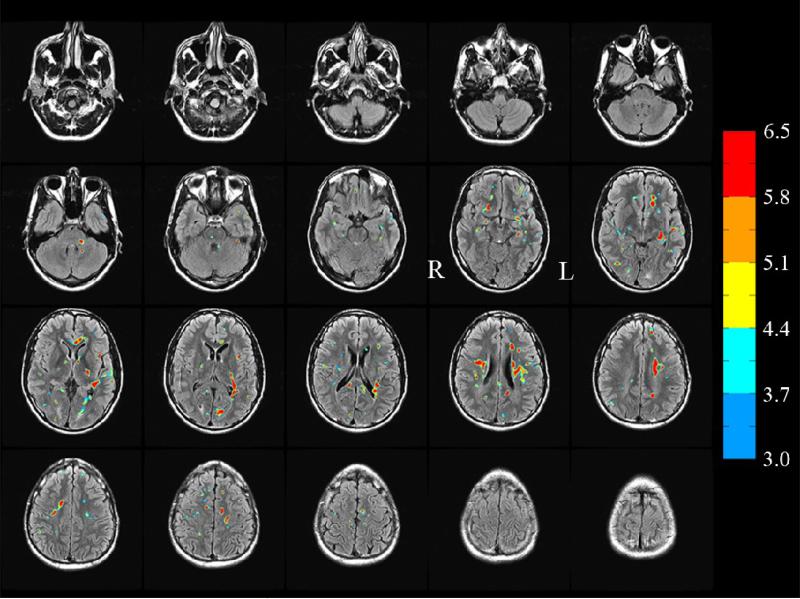
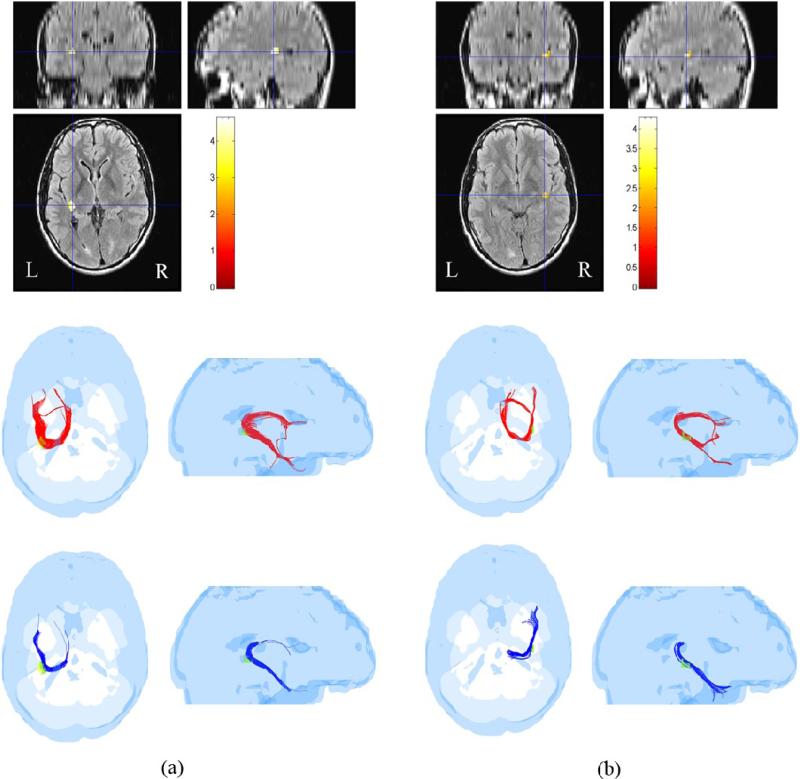
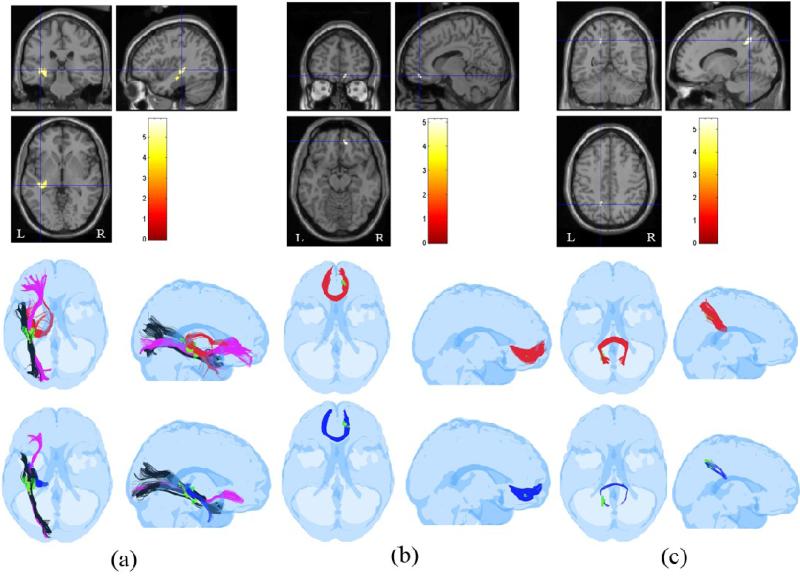
Results: Sites of injury within individual TBI subjects and affected pathways included hippocampal/fornix, inferior fronto-occipital, inferior longitudinal fasciculus, corpus callosum (genu and splenium), cortico-spinal tracts and the uncinate fasciculus. Most of these regions were also detected in the group study.
Conclusions: The DTI normalization methodology presented here enables automatic delineation of ROIs within the heads of individual subjects (or in a group). These ROIs not only localize and quantify the extent of injury, but also quantify the impact of injury on affected pathways in an individual or in a group of TBI subjects.
Figures
Similar articles
-
DTI measures identify mild and moderate TBI cases among patients with complex health problems: A receiver operating characteristic analysis of U.S. veterans.Neuroimage Clin. 2017 Jun 24;16:1-16. doi: 10.1016/j.nicl.2017.06.031. eCollection 2017. Neuroimage Clin. 2017. PMID: 28725550 Free PMC article.
-
Automated diffusion tensor tractography: implementation and comparison to user-driven tractography.Acad Radiol. 2012 May;19(5):622-9. doi: 10.1016/j.acra.2012.01.002. Epub 2012 Feb 18. Acad Radiol. 2012. PMID: 22342650 Free PMC article.
-
Acute white matter differences in the fornix following mild traumatic brain injury using diffusion tensor imaging.J Neuroimaging. 2013 Apr;23(2):224-7. doi: 10.1111/j.1552-6569.2010.00537.x. Epub 2010 Nov 17. J Neuroimaging. 2013. PMID: 21988147
-
Comparing Region of Interest versus Voxel-Wise Diffusion Tensor Imaging Analytic Methods in Mild and Moderate Traumatic Brain Injury: A Systematic Review and Meta-Analysis.J Neurotrauma. 2019 Apr 15;36(8):1222-1230. doi: 10.1089/neu.2018.5838. Epub 2018 Dec 19. J Neurotrauma. 2019. PMID: 30375271 Free PMC article.
-
Principles and limitations of computational algorithms in clinical diffusion tensor MR tractography.AJNR Am J Neuroradiol. 2011 Jan;32(1):3-13. doi: 10.3174/ajnr.A2041. Epub 2010 Mar 18. AJNR Am J Neuroradiol. 2011. PMID: 20299436 Free PMC article. Review.
Cited by
-
A review of magnetic resonance imaging and diffusion tensor imaging findings in mild traumatic brain injury.Brain Imaging Behav. 2012 Jun;6(2):137-92. doi: 10.1007/s11682-012-9156-5. Brain Imaging Behav. 2012. PMID: 22438191 Free PMC article. Review.
-
Combined Diffusion Tensor and Magnetic Resonance Spectroscopic Imaging Methodology for Automated Regional Brain Analysis: Application in a Normal Pediatric Population.Dev Neurosci. 2017;39(5):413-429. doi: 10.1159/000475545. Epub 2017 Jun 27. Dev Neurosci. 2017. PMID: 28651252 Free PMC article.
-
Diffusion tensor imaging detects white matter abnormalities and associated cognitive deficits in chronic adolescent TBI.Brain Inj. 2013;27(4):454-63. doi: 10.3109/02699052.2012.750756. Epub 2013 Mar 8. Brain Inj. 2013. PMID: 23472581 Free PMC article.
-
Blast-induced tinnitus and hearing loss in rats: behavioral and imaging assays.J Neurotrauma. 2012 Jan 20;29(2):430-44. doi: 10.1089/neu.2011.1934. Epub 2011 Nov 22. J Neurotrauma. 2012. PMID: 21933015 Free PMC article.
-
Whole brain approaches for identification of microstructural abnormalities in individual patients: comparison of techniques applied to mild traumatic brain injury.PLoS One. 2013;8(3):e59382. doi: 10.1371/journal.pone.0059382. Epub 2013 Mar 26. PLoS One. 2013. PMID: 23555665 Free PMC article.
References
-
- Strich SJ. Shearing of nerve fibers as a cause of brain damage due to head injury: a pathological study of twenty cases. Lancet. 1961;2:443–8.
-
- Adams JH, Graham DI, Murray LS, Scott G. Diffuse axonal injury due to nonmissile head injury in humans: an analysis of 45 cases. Ann Neurol. 1982;12:557–63. - PubMed
-
- Gentry LR, Godersky JC, Thompson B. MR imaging of head trauma: review of the distribution and radiopathologic features of traumatic lesions. Am J Roentgenol. 1988;9:101–10. - PubMed
Publication types
MeSH terms
Grants and funding
LinkOut - more resources
Full Text Sources
Other Literature Sources
