. 2009 Nov;50(11):5137-47.
doi: 10.1167/iovs.09-3799. Epub 2009 Jul 15.

Driving with hemianopia, I: Detection performance in a driving simulator

Affiliations

Driving with hemianopia, I: Detection performance in a driving simulator

Alex R Bowers et al. Invest Ophthalmol Vis Sci. 2009 Nov.

Abstract

Purpose: This study was designed to examine the effect of homonymous hemianopia (HH) on detection of pedestrian figures in multiple realistic and hazardous situations within the controlled environment of a driving simulator.

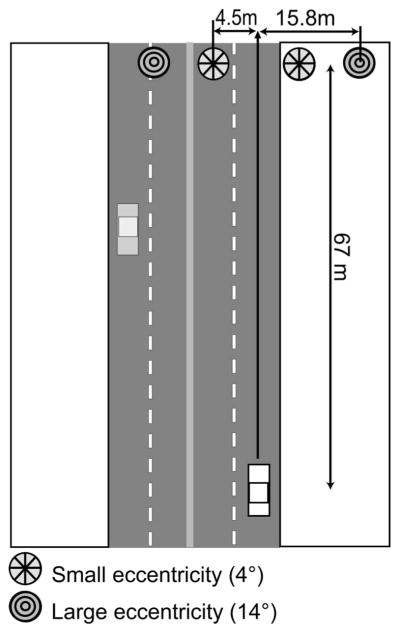
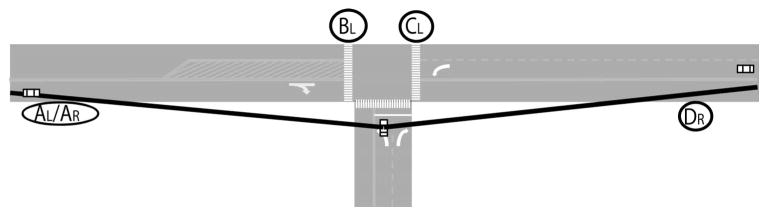
Methods: Twelve people with complete HH and without visual neglect or cognitive decline and 12 matched (age, sex, and years of driving experience) normally sighted (NV) drivers participated. They drove predetermined city and rural highway routes (total, 120 minutes) during which pedestrian figures appeared at random intervals along the roadway (R-Peds; n = 144) and at intersections (I-Peds; n = 10). Detection rates and response times were derived from participant horn presses.

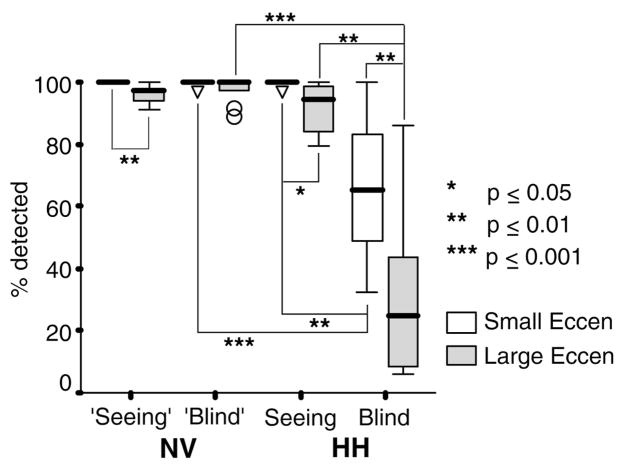
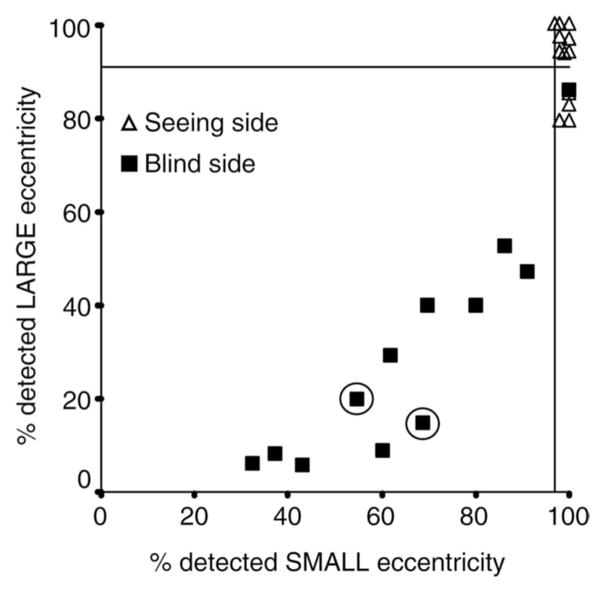
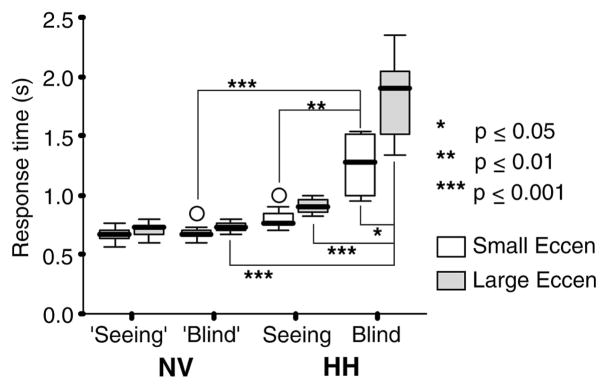
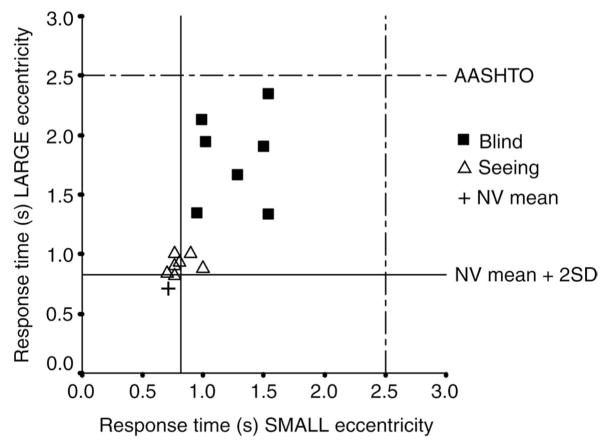
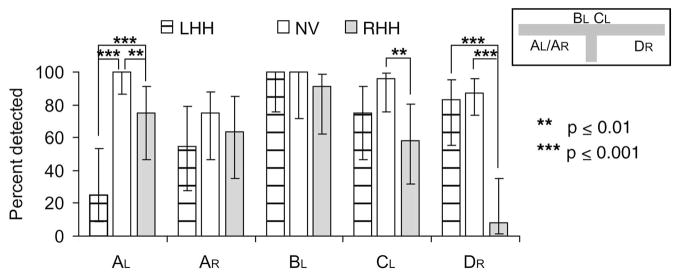
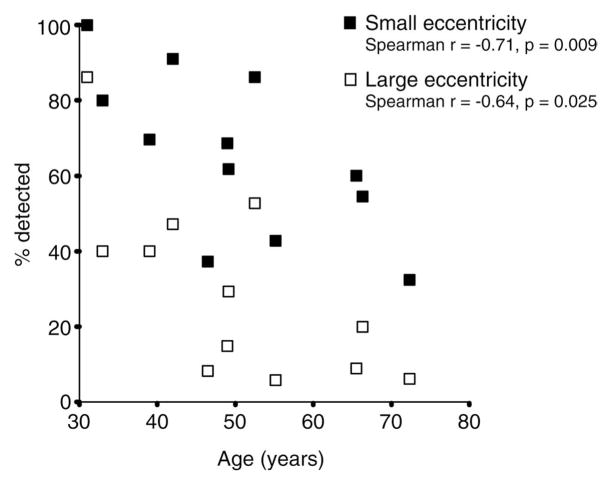
Results: Drivers with HH exhibited significantly (P < 0.001) lower R-Ped detection rates on the blind side than did NV drivers (range, 6%-100%). Detection of I-Peds on the blind side was also poor (8%-55%). Age and blind-side detection rates correlated negatively (Spearman r = -0.71, P = 0.009). Although blind-side response times of drivers with HH were significantly (P < 0.001) longer than those of NV drivers, most were within a commonly used 2.5-second guideline.

Conclusions: Most participants with HH had blind-side detection rates that seem incompatible with safe driving; however, the relationship of our simulator detection performance measures to on-road performance has yet to be established. In determining fitness to drive for people with HH, the results underscore the importance of individualized assessments including evaluations of blind-side hazard detection.


Figures

Figure 1
Figure 1
The four locations at which an R-Ped might appear with respect to the driver in a city drive. The car width was 1.4 m and the travel lane width was 4.0 m.
Figure 2
Figure 2
I-Ped placements (A–D) to assess the effect of HH on detection of potential hazards for a right (R) or left (L) turn. Objects in the direction of A and D could be a hazard for a right-turning vehicle. Objects at or near A, C, and B could be a hazard for a left-turning vehicle. Thick lines: the outline of the recommended clear sight triangle for a stop-controlled intersection at a 30-mph cross street. The driver would have to scan almost 90° to the left and right to view the whole area within the sight triangle. Schematic is approximately to scale.
Figure 3
Figure 3
R-Ped detection rates for data pooled across city and rural drives for 12 NV and 12 drivers with HH. Blind-side detection rates of drivers with HH were significantly lower than those of NV drivers at both small and large eccentricities (P < 0.001); however seeing-side detection rates were similar to those of NV drivers. Thick horizontal line within the box is the median; the vertical extent of the box is the interquartile range (IQR); vertical lines at box ends represent the largest nonoutlier data points within 1.5× IQR; circles are outliers (1.5× to 3× IQR); and triangles are extreme outliers (>3× IQR).
Figure 4
Figure 4
Scatterplot of R-Ped detection rates for 12 drivers with HH at small and large eccentricities on the blind and seeing sides (data pooled across city and rural drives). Blind-side detection rates correlated highly between the two eccentricities (Spearman r = 0.94, P < 0.001). Vertical and horizontal lines: minimum detection rates of NV drivers at small and large eccentricities, respectively. Circled points: participants with HH who wore peripheral prism glasses as a visual field expansion aid when walking; these glasses were not worn during the driving simulator sessions.
Figure 5
Figure 5
R-Ped response times from city drives for the seven NV and seven drivers with HH included in the ANOVA. Response times of drivers with HH were significantly longer than those of NV drivers on both the blind and seeing sides, at both small and large eccentricities (P < 0.001). This figure shows medians and IQRs in boxplot format (details as in Fig. 3); means and SDs are given in Table 2.
Figure 6
Figure 6
Median response times for drivers with HH at small and large eccentricities on the blind and seeing sides in city drives (only the seven drivers with HH in the ANOVA are shown). At both the small and large eccentricities on the blind side, all seven drivers with HH had response times longer than 2 SDs above the NV mean. This was also the case on the seeing side for two drivers with HH. Solid line: 2 SD above NV mean; dashed-dotted line: AASHTO 2.5-second guideline.
Figure 7
Figure 7
Detection rates for I-Peds (inset: approximate I-Ped locations). For the I-Ped at A, detection rates of drivers with LHH were significantly lower than those of NVs and drivers with RHH on a left turn (AL) but not a right turn (AR). For the I-Ped DR, detection rates of drivers with RHH were significantly lower than those of NVs and drivers with LHH on a right turn. For the I-Ped CL, detection rates of drivers with RHH were significantly lower than those of NV drivers on a left turn. Error bars, 95% confidence limits.
Figure 8
Figure 8
Blind-side detection rates for R-Peds as a function of age for drivers with HH.

References

    1. Zhang X, Kedar S, Lynn MJ, Newman NJ, Biousse V. Homonymous hemianopias: clinical-anatomic correlations in 904 cases. Neurology. 2006;66:906–910. - PubMed
    1. Peli E, Peli D. Driving with Confidence: A Practical Guide to Driving with Low Vision. Singapore: World Scientific Publishing; 2002.
    1. Papageorgiou E, Hardiess G, Schaeffel F, et al. Assessment of vision-related quality of life in patients with homonymous visual field defects. Graefes Arch Clin Exp Ophthalmol. 2007;245:1749–1758. - PubMed
    1. de Jong P, Warmink HH. Homonymous hemianopia and driving (letter) Eye. 2003;17:545. - PubMed
    1. Burgess SEP. Homonymous hemianopia and driving: reply. Eye. 2003;17:545–546. - PubMed

Publication types

LinkOut - more resources