. 2009 Nov;8(11):2405-17.
doi: 10.1074/mcp.M900317-MCP200. Epub 2009 Jul 16.

Protein identification false discovery rates for very large proteomics data sets generated by tandem mass spectrometry

Affiliations

Protein identification false discovery rates for very large proteomics data sets generated by tandem mass spectrometry

Lukas Reiter et al. Mol Cell Proteomics. 2009 Nov.

Abstract

Comprehensive characterization of a proteome is a fundamental goal in proteomics. To achieve saturation coverage of a proteome or specific subproteome via tandem mass spectrometric identification of tryptic protein sample digests, proteomics data sets are growing dramatically in size and heterogeneity. The trend toward very large integrated data sets poses so far unsolved challenges to control the uncertainty of protein identifications going beyond well established confidence measures for peptide-spectrum matches. We present MAYU, a novel strategy that reliably estimates false discovery rates for protein identifications in large scale data sets. We validated and applied MAYU using various large proteomics data sets. The data show that the size of the data set has an important and previously underestimated impact on the reliability of protein identifications. We particularly found that protein false discovery rates are significantly elevated compared with those of peptide-spectrum matches. The function provided by MAYU is critical to control the quality of proteome data repositories and thereby to enhance any study relying on these data sources. The MAYU software is available as standalone software and also integrated into the Trans-Proteomic Pipeline.


Figures
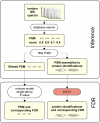
Fig. 1.
Fig. 1.
Protein inference and false discovery rate estimation. Tandem mass spectra are searched against a sequence database where each spectrum is assigned to the best matching, i.e. highest scoring, peptide sequence. These assignments are referred to as PSMs. The PSMs can then be filtered according to their score. The quality of the filtered PSMs is usually specified in terms of PSM FDRs. Score cutoffs for PSMs are usually selected according to a user-defined maximal PSM FDR. Alternatively the filtered PSMs can first be assembled to protein identifications. The quality of the assignments is then assessed on the level of protein identifications. MAYU provides a strategy to quantify this quality in terms of the protein identification FDR. Compared with the PSM FDR, the protein identification FDR is a more informative quality measure because it operates on biological entities of interest, i.e. proteins.
Fig. 2.
Fig. 2.
MAYU protein identification false discovery rate estimation. Estimation of the PSM FDR using a target-decoy strategy (a) and the protein identification (PID) FDR by MAYU (b) is shown. PSMs in the target database can be FP or TP. The PSM FDR (the expected fraction of false positive target PSMs) can be estimated with the number of decoy PSMs that are false positive by definition. The PSM FDR is currently the major measure used for quality control of mass spectrometric data sets (a). The derivation of the protein identification FDR has to account for protein identifications containing false positive PSMs (CF) although not being false positive protein identifications (b; two proteins). To estimate the expected number of true positive (htp) and false positive (hfp) protein identifications, MAYU implements a hypergeometric model that takes the number of target (ht) and decoy (hcf) protein identifications and the total number of protein entries in the database (N) as input. The hypothetical example illustrates that the PSM FDR (25%) and the protein identification FDR (45%) can differ largely.
Fig. 3.
Fig. 3.
Robustness of the false discovery rate estimates of MAYU. MAYU imposes the assumption that protein identifications containing false positive PSMs uniformly distribute over the protein database. To closely meet this assumption MAYU operates on a partition of the protein database into subsets comprising proteins of similar size. The figure depicts how the size of the partition affects the protein identification FDR estimates for different sets of PSMs defined over the complete C. elegans data set (a). Partitions with more than 10 size bins yield stable FDR estimates and therefore seem to yield the desired protein size homogeneity. b, simulation studies for the complete C. elegans set where we explicitly distributed false positive PSMs according to distributions increasingly deviating from uniformity (see “Experimental Procedures”). We assessed the accuracy of the MAYU estimate in terms of relative deviation from the true FDR depending on the degree of uniformity of the false positive PSM distribution. The inset plot exemplarily depicts four distributions of varying uniformity. We observed that the MAYU estimates do not deviate more than 1% from the true FDR (e.g. 0.2 ± 0.002%) even for considerable deviations from the uniformity assumption. PID, protein identification.
Fig. 4.
Fig. 4.
Validation of the false discovery rate estimates of MAYU. We validated the MAYU FDR using two data sets of different size and with two distinct methods. We used experiment 15 (67 LC-MS/MS runs) of the C. elegans data set where experimental pI information of peptides was available (a and b), and we generated synthetic peptides to validate the FDRs of the complete C. elegans data set (1,305 LC-MS/MS runs) (c). Using experiment 15 we derived a measure of the discrepancy between the measured and the computationally predicted pI values of peptides, σΔpI (see “Experimental Procedures”). Sets of PSMs filtered with increasing PSM FDR up to 0.2 show an increase in σΔpI (a, blue curve). σΔpI for only the single hits is significantly higher than for all PSMs over the complete range indicating that the single hit FDR is much higher compared with the PSM FDR (a, green and blue curves). The error bars specify standard deviations from 20 bootstraps. Using σΔpI of all PSMs as a calibration curve we could estimate the single hit FDR assuming that TP single hits are not generally different from the rest of PSMs in terms of pI (b). We also calculated a corrected single hit FDR (a and b, brown curve) by making the reasonable assumption that TP single hit peptides focused better in the isoelectric focusing experiment (a; see offset of σΔpI at zero PSM FDR between the single hits and all PSMs). We found strong consistency between MAYU and the independent method based on peptide pI information (b). We ordered three sets of synthetic peptides corresponding to randomly picked PSMs of three different classes from the complete C. elegans data set (see “Experimental Procedures”). We recorded tandem mass spectra of the synthetic peptides in a directed way using inclusion lists and compared them with the corresponding spectra of the C. elegans data set (c). 35 peptides of the negative control (c, red), 42 peptides of the positive control (c, blue), and 114 peptides of our peptides of interest (c, gray) were identified with a stringent cutoff. We could nicely separate the distributions of positive and negative controls using the summed intensity difference (see “Experimental Procedures”). Based on a Gaussian mixture model of the positive and negative controls we estimated the fraction of false positives of our peptides of interest as 0.49, which is very consistent with the estimated 0.47 of MAYU.
Fig. 5.
Fig. 5.
Comparison of different protein identification false discovery rate estimation strategies. We compared the protein identification FDR estimates of MAYU, ProteinProphet, and the naïve target-decoy strategy for four different data set sizes (1, 5, 10, and 20 experiments of the C. elegans data set; a–d). The discrepancy of the alternative FDR estimates and the MAYU estimates grows with data set size.
Fig. 6.
Fig. 6.
Protein identification false discovery rates behave similarly for data sets of different species and instruments and largely depend on the size of the data set. We applied MAYU to three different data sets of similar size but from different organisms and instruments (59,918 (a), 40,008 (b), and 65,553 (c) target PSMs for a PSM FDR of 0.01). In all three data sets the protein identification FDR is roughly 5 times higher than the PSM FDR. The number of estimated TP protein identifications reaches an apparent maximal number of identifications for a very low PSM FDR (a–c and f). We investigated the influence of data set size using 20 compilations from the C. elegans data set representing 1–20 cumulative experiments. The ratio of the protein identification FDR to PSM FDR (protein identification FDR/PSM FDR) shows clear dependence on data set size (d). In the complete data set (1,305 LC-MS/MS runs) the protein identification FDR is more than 20-fold higher than the PSM FDR. For all data set sizes the protein identification FDR is elevated compared with the PSM FDR over the whole range of PSM FDR (e), and the apparent maximal number of TP protein identifications is reached for a very stringent PSM FDR of roughly 0.005 (f). These data suggest that increasing the PSM FDR beyond 0.005 mainly entails an accumulation of FP protein identifications.

References

    1. Aebersold R., Mann M. (2003) Mass spectrometry-based proteomics. Nature 422,198–207 - PubMed
    1. Brunner E., Ahrens C. H., Mohanty S., Baetschmann H., Loevenich S., Potthast F., Deutsch E. W., Panse C., de Lichtenberg U., Rinner O., Lee H., Pedrioli P. G., Malmstrom J., Koehler K., Schrimpf S., Krijgsveld J., Kregenow F., Heck A. J., Hafen E., Schlapbach R., Aebersold R. (2007) A high-quality catalog of the Drosophila melanogaster proteome. Nat. Biotechnol. 25,576–583 - PubMed
    1. Foster L. J., de Hoog C. L., Zhang Y., Zhang Y., Xie X., Mootha V. K., Mann M. (2006) A mammalian organelle map by protein correlation profiling. Cell 125,187–199 - PubMed
    1. King N. L., Deutsch E. W., Ranish J. A., Nesvizhskii A. I., Eddes J. S., Mallick P., Eng J., Desiere F., Flory M., Martin D. B., Kim B., Lee H., Raught B., Aebersold R. (2006) Analysis of the Saccharomyces cerevisiae proteome with PeptideAtlas. Genome Biol. 7, R106. - PMC - PubMed
    1. Omenn G. S., States D. J., Adamski M., Blackwell T. W., Menon R., Hermjakob H., Apweiler R., Haab B. B., Simpson R. J., Eddes J. S., Kapp E. A., Moritz R. L., Chan D. W., Rai A. J., Admon A., Aebersold R., Eng J., Hancock W. S., Hefta S. A., Meyer H., Paik Y. K., Yoo J. S., Ping P., Pounds J., Adkins J., Qian X., Wang R., Wasinger V., Wu C. Y., Zhao X., Zeng R., Archakov A., Tsugita A., Beer I., Pandey A., Pisano M., Andrews P., Tammen H., Speicher D. W., Hanash S. M. (2005) Overview of the HUPO Plasma Proteome Project: results from the pilot phase with 35 collaborating laboratories and multiple analytical groups, generating a core dataset of 3020 proteins and a publicly-available database. Proteomics 5,3226–3245 - PubMed

Publication types

LinkOut - more resources