. 2009 Sep 11;284(37):25116-25.
doi: 10.1074/jbc.M109.010132. Epub 2009 Jul 16.

Protein kinase A increases type-2 inositol 1,4,5-trisphosphate receptor activity by phosphorylation of serine 937

Affiliations

Protein kinase A increases type-2 inositol 1,4,5-trisphosphate receptor activity by phosphorylation of serine 937

Matthew J Betzenhauser et al. J Biol Chem. .

Abstract

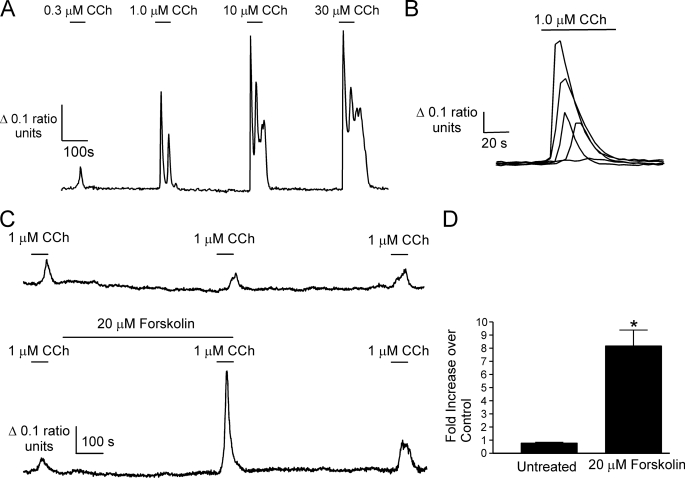
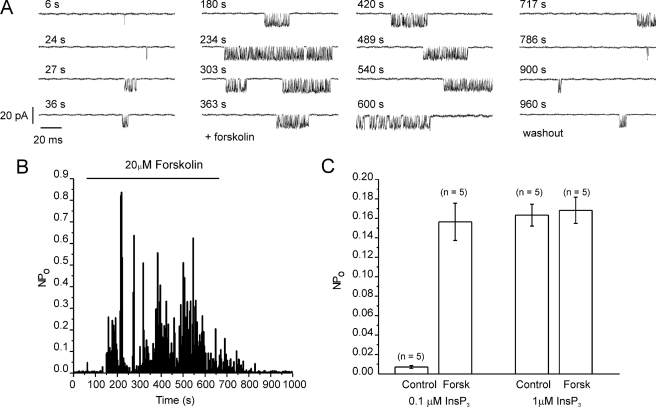
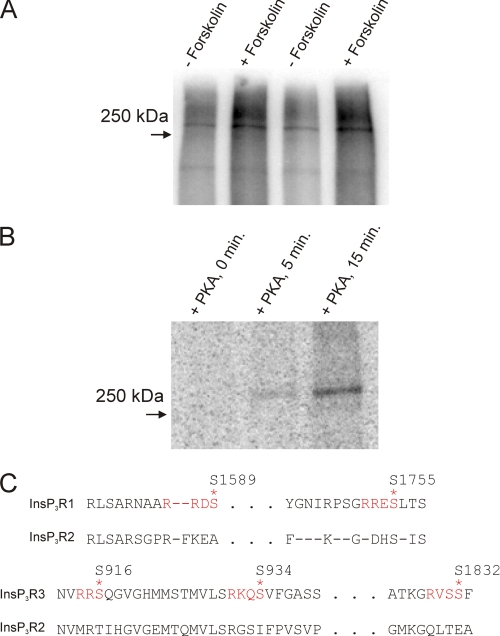
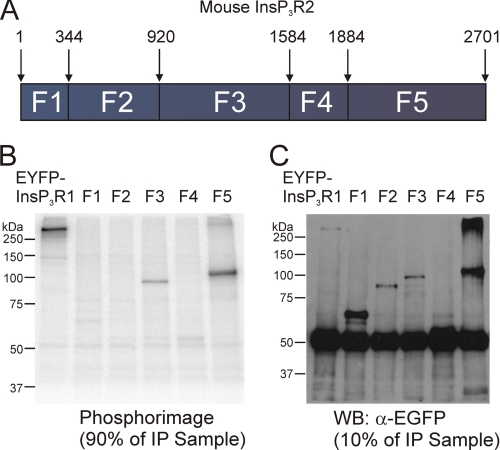
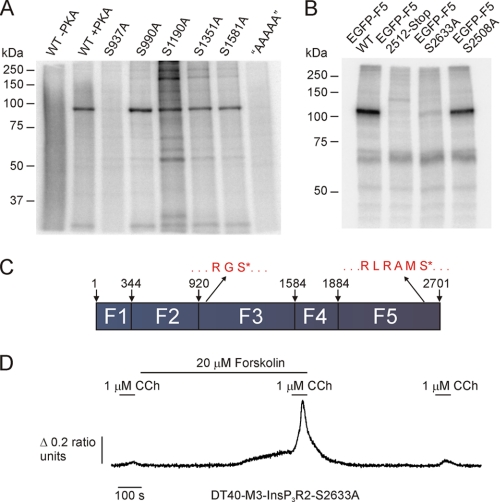
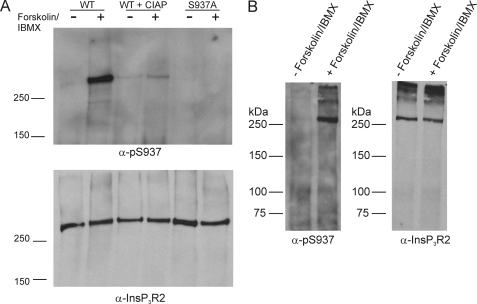
Protein kinase A (PKA) phosphorylation of inositol 1,4,5-trisphosphate receptors (InsP(3)Rs) represents a mechanism for shaping intracellular Ca(2+) signals following a concomitant elevation in cAMP. Activation of PKA results in enhanced Ca(2+) release in cells that express predominantly InsP(3)R2. PKA is known to phosphorylate InsP(3)R2, but the molecular determinants of this effect are not known. We have expressed mouse InsP(3)R2 in DT40-3KO cells that are devoid of endogenous InsP(3)R and examined the effects of PKA phosphorylation on this isoform in unambiguous isolation. Activation of PKA increased Ca(2+) signals and augmented the single channel open probability of InsP(3)R2. A PKA phosphorylation site unique to the InsP(3)R2 was identified at Ser(937). The enhancing effects of PKA activation on this isoform required the phosphorylation of Ser(937), since replacing this residue with alanine eliminated the positive effects of PKA activation. These results provide a mechanism responsible for the enhanced Ca(2+) signaling following PKA activation in cells that express predominantly InsP(3)R2.


Figures

FIGURE 1.
FIGURE 1.
Forskolin enhances CCh-evoked Ca2+ responses in DT40-M3 cells expressing mouse InsP3R2. An expression construct harboring cDNA for mouse InsP3R2 was introduced into DT40-M3 cells. A, a representative Fura-2 recording from a single cell showing increasing Ca2+-transient amplitudes with increasing CCh concentrations. B, the range of Ca2+ signal amplitudes observed in five cells from a single experiment to stimulation with 1 μm CCh. C, upper trace, a Fura-2 recording from a DT40-M3 cell expressing mouse InsP3R2 stimulated three times with 1 μm CCh (n = 3 experimental runs). Lower trace, the effect of raising cAMP with forskolin on a 1 μm CCh-evoked Ca2+ transient (n = 5 experimental runs). D, pooled data from the indicated number of experiments comparing the second 1 μm CCh treatment with the first in the absence and presence of forskolin (*, p ≤ 0.05, Student's unpaired t test).
FIGURE 2.
FIGURE 2.
Activation of PKA results in increased InsP3R2 single channel activity. Whole cell patch clamp recordings were made in DT40-3KO cells stably expressing InsP3R2. A, representative sweeps from cells at a holding potential of −100 mV. Channel activity is observed with 100 nm InsP3 in the patch pipette. The activity is markedly enhanced following exposure to forskolin, which was applied at 60 s and removed at 660 s, as indicated by the bar in B. B, a diary plot of activity during each sweep. C, pooled data from experiments with both 100 nm and 1 μm InsP3.
FIGURE 3.
FIGURE 3.
Mammalian InsP3R2 is phosphorylated in response to raising cAMP in metabolically labeled COS-7 cells and in vitro by purified PKA. COS-7 cells were transfected with mouse InsP3R2 cDNA (A). 36 h after transfection, cells were metabolically labeled with 32PO4 prior to forskolin treatment, immunoprecipitation, and PAGE. A, phosphor image of a dried gel loaded with samples from mouse InsP3R2-expressing cells. Greater 32P incorporation into a ∼250 kDa band in the forskolin-treated transfected samples indicated phosphorylation of InsP3R2. B, mouse InsP3R2 was immunoprecipitated from COS-7 cells and incubated with purified PKA at 37 °C in the presence of [γ-32P]ATP for the indicated times. Results are representative of at least two separate experiments for each condition. C, alignments of InsP3R sequences around the PKA phosphorylation sites in InsP3R1 and InsP3R3. None of the sites present in these isoforms are present in InsP3R2.
FIGURE 4.
FIGURE 4.
PKA phosphorylates two different fragments of mouse InsP3R2. A, a schematic diagram depicting the boundaries of the fragments used to identify PKA-phosphorylated residues in mouse InsP3R2. The predicted sizes of the EGFP-tagged subclones are as follows: EGFP-F1, ∼65 kDa; EGFP-F2, ∼94 kDa; EGFP-F3, ∼102 kDa; EGFP-F4, ∼60 kDa; EGFP-F5, ∼120 kDa. EGFP-tagged subclones of mouse InsP3R2 were expressed in COS-7 cells, immunoprecipitated, and then subjected to in vitro PKA assays prior to PAGE. B, phosphor image from 90% of the immunoprecipitated sample. 32P was incorporated into samples containing enhanced yellow fluorescent protein-InsP3R1, EGFP-fragment 3, and EGFP-fragment 5. C, a Western blot with the remaining 10% of the immunoprecipitated samples from B probed with α-GFP. Bands of the appropriate sizes indicate the successful immunoprecipitation of all five fragments.
FIGURE 5.
FIGURE 5.
PKA phosphorylates fragment 3 of mouse InsP3R2 at Ser937 and fragment 5 at Ser2633. Mutants in InsP3R2 fragment 3 were generated corresponding to Ser937, Ser990, Ser1190, Ser1351, and Ser1581. Another mutant harboring all five mutations was also generated (AAAAA). A, the phosphor image from an in vitro PKA assay with wild type, S937A, S990A, S1190A, S1351A, S1581A, and “AAAAA” mutated fragment 3 fusions. PKA phosphorylated all fragments except S937A and “AAAAA,” indicating that Ser937 is the sole PKA phosphorylation site in fragment 3 of mouse InsP3R2. Mutations in fragment 5 corresponding to S2508A, a truncation at 2512, and S2633A were generated. B, phosphor image from an in vitro PKA assay with these samples. PKA phosphorylated the wild type and S2508A mutated fragment 5 fusions but failed to phosphorylate the truncated or S2633A mutated fusions. C, schematic diagram depicting the positions of the Ser937 and Ser2633 phosphorylation sites in the context of the full-length mouse InsP3R2. D shows that, following PKA activation, Ca2+ signals are still augmented in cells expressing InsP3R2 S2633A.
FIGURE 6.
FIGURE 6.
PKA phosphorylates full-length mouse InsP3R2 at Ser937. Wild type and S937A mutated full-length mouse InsP3R2 were expressed in COS-7 cells. The cells were treated with forskolin and IBMX, and InsP3R2 proteins were immunoprecipitated and separated by PAGE. A, results of a Western blot probed with α-Ser(P)937. The antibody recognized a band at the appropriate size in the wild type sample but not in a parallel sample treated with calf intestine alkaline phosphatase prior to PAGE. The antibody also failed to recognize a band in the S937A mutant sample. The lower panel shows a Western blot on the same membrane after stripping and reprobing with an α-InsP3R2 antibody, indicating equal expression in all samples. B, parotid acinar cells were isolated from mice and left untreated or treated with forskolin + IBMX. InsP3R2 was immunoprecipitated from the samples and separated by PAGE. The left panel shows a Western blot of samples probed with α-Ser(P)937. The antibody recognizes an appropriate band in the forskolin/IBMX-treated sample. The right panel shows a Western blot from the same membrane after stripping and reprobing with an antibody against InsP3R2.
FIGURE 7.
FIGURE 7.
cBIMPs enhances muscarinic receptor-induced Ca2+ transients in cells stably expressing wild type, but not S937A mutated InsP3R2. Stable DT40 cell lines were generated expressing wild type (DT40-InsP3R2) or S937A mutated (DT40-InsP3R2-S937A) InsP3R2. Cells were transfected with cDNA expressing M3R, and Fura-2 measurements were made on cells treated with CCh in the presence or absence of cBIMPs, as indicated. In these experiments, the acquisition rate was decreased between CCh stimulations. A, examples of the effects of cBIMPs on DT40-InsP3R2 cells from four independent experiments; B, examples of responses in four independent experiments with DT40-InsP3R2-S937A cells.

References

    1. Berridge M. J. (1993) Nature 361, 315–325 - PubMed
    1. Bruce J. I., Straub S. V., Yule D. I. (2003) Cell Calcium 34, 431–444 - PubMed
    1. Natarajan M., Lin K. M., Hsueh R. C., Sternweis P. C., Ranganathan R. (2006) Nat. Cell Biol. 8, 571–580 - PubMed
    1. Bruce J. I., Shuttleworth T. J., Giovannucci D. R., Yule D. I. (2002) J. Biol. Chem. 277, 1340–1348 - PubMed
    1. Straub S. V., Wagner L. E., 2nd, Bruce J. I., Yule D. I. (2004) Biol. Res. 37, 593–602 - PubMed

Publication types