. 2009 Aug;175(2):636-48.
doi: 10.2353/ajpath.2009.090131. Epub 2009 Jul 16.

Organotypic culture model of pancreatic cancer demonstrates that stromal cells modulate E-cadherin, beta-catenin, and Ezrin expression in tumor cells

Affiliations

Organotypic culture model of pancreatic cancer demonstrates that stromal cells modulate E-cadherin, beta-catenin, and Ezrin expression in tumor cells

Fieke E M Froeling et al. Am J Pathol. 2009 Aug.

Abstract

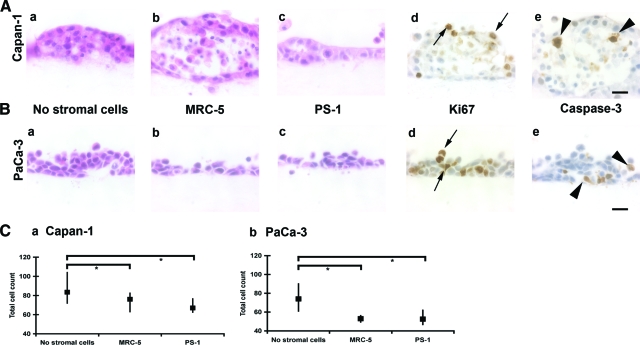
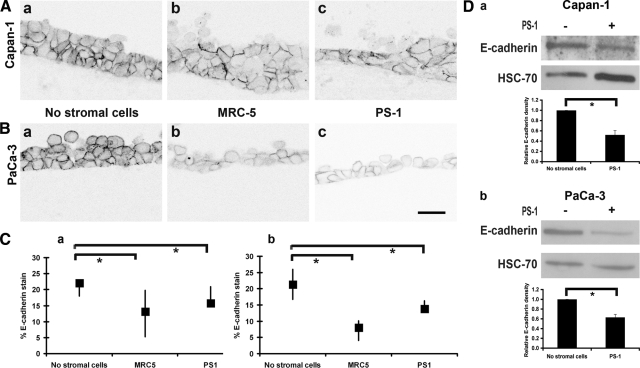
Pancreatic cancer is characterized by an intense stromal reaction. Reproducible three-dimensional in vitro systems for exploring interactions of the stroma with pancreatic cancer cells have not previously been available, prompting us to develop such a model. Cancer cells were grown on collagen/Matrigel and embedded with or without stromal cells (hTERT-immortalized human PS-1 stellate cells or MRC-5 fibroblasts) for 7 days. Proliferation and apoptosis, as well as important cell-cell adhesion and cytoskeleton-regulating proteins, were studied. PS-1 cells were confirmed as stellate based on the expression of key cytoskeletal proteins and lipid vesicles. Capan-1, and to a lesser extent PaCa-3, cells differentiated into luminal structures, exhibiting a central apoptotic core with a proliferating peripheral rim and an apico-basal polarity. Presence of either stromal cell type translocated Ezrin from apical (when stromal cells were absent) to basal aspects of cancer cells, where it was associated with invasive activity. Interestingly, the presence of 'normal' (not tumor-derived) stromal cells induced total tumor cell number reduction (P < 0.005) associated with a significant decrease in E-cadherin expression (P < 0.005). Conversely, beta-catenin expression was up-regulated (P < 0.01) in the presence of stromal cells with predominant cytoplasmic expression. Moreover, patient samples confirmed that these data recapitulated the clinical situation. In conclusion, pancreatic organotypic culture offers a reproducible, bio-mimetic, three-dimensional in vitro model that allows examination of the interactions between stromal elements and pancreatic cancer cells.


Figures

Figure 1
Figure 1
Expression of stellate cell markers by immortalized PS-1 cells and their proliferation on different substrates. A: Isolated and immortalized PS-1 cells express the stellate cell markers desmin, GFAP, αSMA, and vimentin (a–d). Scale bar = 20 μm. B: Oil Red O visualized fat storing vesicles (arrowheads) in the cytoplasm of immortalized PS-1 cells (a), which store vitamin A as detected by autofluorescent particles (b, arrows). Scale bar = 5 μm. C: (a) Proliferation of PS-1 cells is unaffected by culture on various substrates, including diluted collagen type I (C), fibronectin (F), Matrigel (M) or PBS alone (P). C (b): Western blot of key stellate cell marker, α-SMA, after culture on various substrates, alongside cell lysates from pancreatic cancer cells (HPAF, PaCa-3) and human pancreatic fibroblasts (HPF).
Figure 2
Figure 2
Organotypic cultures. A and B: H&E stain demonstrates differences observed in morphology after culturing Capan-1 (A) and PaCa-3 (B) cells on gels with no stromal cells (a), MRC-5 fibroblasts (b), or PS-1 stellate cells (c). Images (d) and (e) demonstrate the different zones of proliferating (Ki-67 immunostain, arrows, d) and apoptotic (active caspase-3 immunostain, arrowheads, e) cells, which leads to lumen formation. Scale bar = 20 μm. C: Total counts per high power field for Capan-1 cell gels (a) and PaCa-3 cell gels (b) at day 7 (median, interquartile range). Mann-Whitney U-test; *P < 0.05.
Figure 3
Figure 3
Expression of E-cadherin and p-ERM. (A) and (B) show 3D reconstruction and rendering of a z-stack of immunofluorescent images of Capan-1 (a) and PaCa-3 (b) cells for E-cadherin (A) and p-ERM (B). E-cadherin is seen primarily at points of cell–cell contact while loss of E-cadherin expression is seen where cells either are in contact with the extracellular matrix (Mx, arrowheads) or with the medium. Insets show E-cadherin and p-ERM expression in an invagination of cells into the extracellular matrix. Note that E-cadherin expression is lost while p-ERM is expressed at the cell–matrix junction both in Capan-1 and PaCa-3 cells (arrow heads). P-ERM also is expressed at the margins of newly forming microlumens (sL = microlumens, L = large lumen). Scale bar = 100 μm.
Figure 4
Figure 4
E-cadherin expression in organotypic cultures. (A) (Capan-1) and (B) (PaCa-3) organotypic gels with no stromal cells (a), MRC-5 (b), and PS-1 (c) cells respectively with E-cadherin immunofluorescent stain rendered gray. Scale bar = 20 μm. C: Quantification of E-cadherin stain is shown in graphs (median and interquartile ranges) for Capan-1 (a) and PaCa-3 (b) cells (Mann-Whitney U-test; *P < 0.005) in response to presence of stromal cells. Supplemental Movie 1 (http://ajp.amjpathol.org) shows the animation of z-stacks across one-cell thickness, along with nuclear stain to illustrate the focal loss of E-cadherin. D: The Western blot of Capan-1 (a) and PaCa-3 (b) cells isolated from the supernatant of organotypic gels shows loss of E-cadherin in the presence of PS-1 stellate cells. Quantification of replicates is shown in respective graphs (mean ± SEM, Student’s t-test; *P < 0.05).
Figure 5
Figure 5
β-Catenin expression in organotypic gels. (A) (Capan-1) and (B) (PaCa-3) organotypic gels with no stromal cells (a), MRC-5 (b), and PS-1 (c) cells respectively showing β-catenin expression by immunofluorescent stain rendered as a gray image. Quantification of number of cells with β-catenin expression (median and interquartile ranges) in the membrane and cytoplasm is shown in (d) and (e) respectively (Mann-Whitney U-test; *P < 0.005) in response to presence of stromal cells. Scale bar = 20 μm.
Figure 6
Figure 6
Ezrin expression in invading processes and cells. (A) (Capan-1) and (B) (PaCa-3) organotypic gels with no stromal cells (a), MRC-5 (b), and PS-1 (c) cells respectively with Ezrin immunofluorescent stain rendered as a gray image and the invading cells and processes shown by arrows. Quantification of number of Ezrin-positive processes (median and interquartile ranges) of cells (d), as well as whole cells (e) shows a significant increase of these (Mann-Whitney U-test; *P < 0.005) in response to the presence of stromal cells, which did not stain for Ezrin. Supplemental Movie 2 (http://ajp.amjpathol.org) shows the animation of z-stacks across one-cell thickness, along with nuclear stain to demonstrate the depth of invasion. Scale bar = 20 μm.
Figure 7
Figure 7
β-catenin and E-cadherin expression in patient samples. A: Shows β-catenin expression in normal (a) and pancreatic cancer ducts (b, c, d). A(a) demonstrates no expression in small ducts of normal pancreas (arrowheads), with robust cell–cell junction expression in acinar cells (arrows). A(b, c, d) show heterogeneous expression of β-catenin at the cell–cell junctions, cytoplasm (arrowheads), and nucleus (arrows) when cells are invading the surrounding stroma (b), the perineural region (c, N = nerve), and lymph nodes (d, LN = lymph node). Scale bar = 20 μm. (B) shows E-cadherin expression in normal (a) and pancreatic cancer ducts (b, c, d). B(a) demonstrates strong membranous expression in ducts of normal pancreas (arrowheads) and in acinar cells (arrow). B(b, c, d) show heterogeneous expression of E-cadherin with pancreatic ductal adenocarcinoma cells not expressing E-cadherin (arrowheads) or a more cytoplasmic expression (arrows) when invading the surrounding stroma (b), the perineural region (c, N = nerve) and lymph nodes (d, LN = lymph node). Scale bar = 20 μm.

References

    1. O'Sullivan A, Kocher HM: Pancreatic cancer. BMJ Clin Evid 2007, 11:409–436. Available online at http://clinicalevidence.bmj.com (accessed Oct 2008). Subscription only. - PubMed
    1. Hariharan D, Saied A, Kocher HM. Analysis of mortality rates for pancreatic cancer across the world. HPB (Oxford) 2008;10:58–62. - PMC - PubMed
    1. Jones S, Zhang X, Parsons DW, Lin JC, Leary RJ, Angenendt P, Mankoo P, Carter H, Kamiyama H, Jimeno A, Hong SM, Fu B, Lin MT, Calhoun ES, Kamiyama M, Walter K, Nikolskaya T, Nikolsky Y, Hartigan J, Smith DR, Hidalgo M, Leach SD, Klein AP, Jaffee EM, Goggins M, Maitra A, Iacobuzio-Donahue C, Eshleman JR, Kern SE, Hruban RH, Karchin R, Papadopoulos N, Parmigiani G, Vogelstein B, Velculescu VE, Kinzler KW. Core signaling pathways in human pancreatic cancers revealed by global genomic analyses. Science. 2008;321:1801–1806. - PMC - PubMed
    1. Gaggioli C, Hooper S, Hidalgo-Carcedo C, Grosse R, Marshall JF, Harrington K, Sahai E. Fibroblast-led collective invasion of carcinoma cells with differing roles for RhoGTPases in leading and following cells. Nat Cell Biol. 2007;9:1392–1400. - PubMed
    1. Beacham DA, Cukierman E. Stromagenesis: the changing face of fibroblastic microenvironments during tumor progression. Semin Cancer Biol. 2005;15:329–341. - PubMed

Publication types