. 2009 Jul 17;325(5938):290-4.
doi: 10.1126/science.1172330.

Demographic variability, vaccination, and the spatiotemporal dynamics of rotavirus epidemics

Affiliations

Demographic variability, vaccination, and the spatiotemporal dynamics of rotavirus epidemics

Virginia E Pitzer et al. Science. .

Abstract

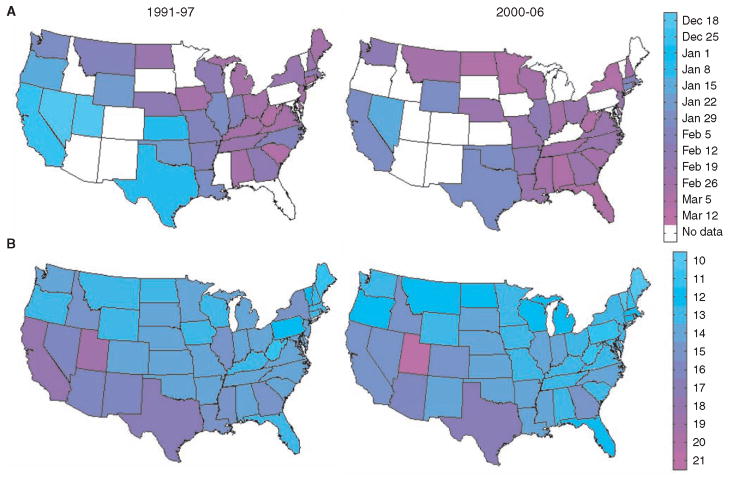
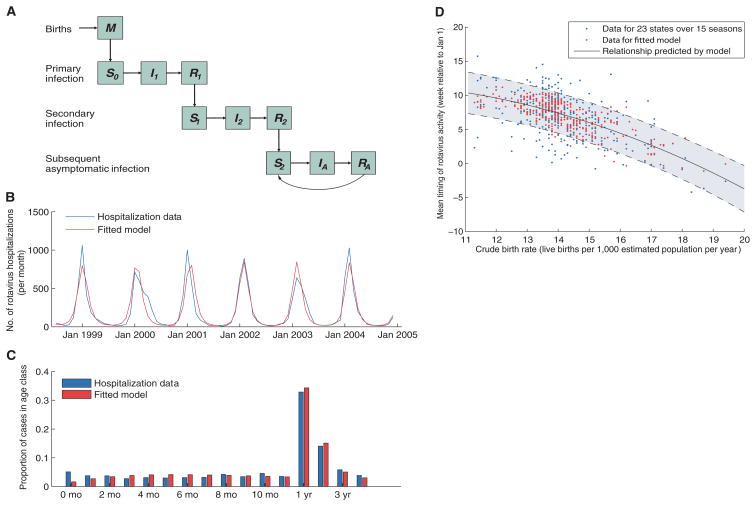
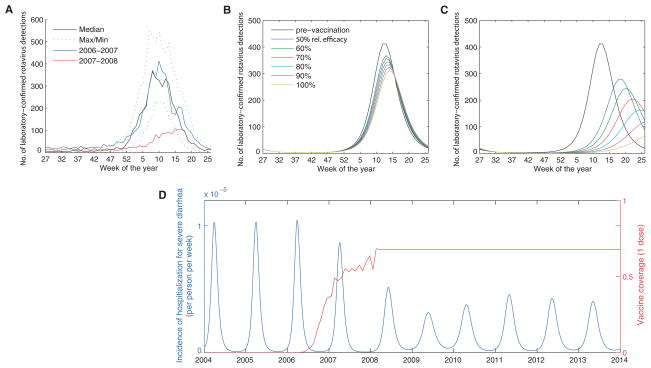
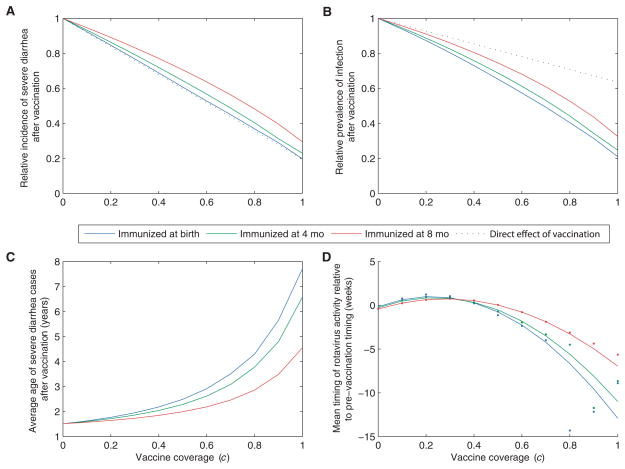
Historically, annual rotavirus activity in the United States has started in the southwest in late fall and ended in the northeast 3 months later; this trend has diminished in recent years. Traveling waves of infection or local environmental drivers cannot account for these patterns. A transmission model calibrated against epidemiological data shows that spatiotemporal variation in birth rate can explain the timing of rotavirus epidemics. The recent large-scale introduction of rotavirus vaccination provides a natural experiment to further test the impact of susceptible recruitment on disease dynamics. The model predicts a pattern of reduced and lagged epidemics postvaccination, closely matching the observed dynamics. Armed with this validated model, we explore the relative importance of direct and indirect protection, a key issue in determining the worldwide benefits of vaccination.


Figures

Fig. 1
Fig. 1
Spatiotemporal pattern of rotavirus epidemics and birth rates in the United States. (A) Map of mean week of rotavirus activity for the period from 1991–1997 and 2000–2006. Mean timing of annual rotavirus activity was calculated for states that reported rotavirus-positive specimens to the NREVSS for at least four of the six rotavirus seasons. (B) Average crude birth rates by state (live births per 1000 estimated population per year) for 1991–1997 and 2000–2006 according to National Vital Statistics Reports.
Fig. 2
Fig. 2
Description of model and model fit. (A) Compartmental diagram illustrating the transmission model. See (10) for a more detailed description. (B and C) Fit of the model to age-specific hospitalization data from the California HCUP SID for (B) the number of hospitalizations per month in children 0 to 4 years of age and (C) the age distribution of hospitalized rotavirus cases (0 to 11 months and 1 to 4 years of age). (D) Timing of rotavirus epidemics based on laboratory-confirmed NREVSS data versus the state-specific crude birth rate in the preceding year. We calculated the mean timing of annual rotavirus activity for each of the 23 states and 15 rotavirus seasons (1991 to 2006) by weighting each calendar week by the proportion of rotavirus detections occurring that week. Observed data are plotted in blue, whereas the red dots represent predictions from the fitted model driven by birth rate. The relationship between the birth rate and timing of epidemics predicted by our model is given by the solid black line, whereas the shaded area between dashed lines represents the 95% confidence interval for the predicted relationship.
Fig. 3
Fig. 3
Effect of vaccination on the size and timing of the epidemic in the first and second years following the introduction of the vaccine. (A) Weekly number of rotavirus-positive tests from participating NREVSS laboratories, 1991–2006, compared with 2007–2008, by week of year. (B and C) Weekly incidence of laboratory-confirmed rotavirus detections predicted by the model for an average prevaccination epidemic (black) and the epidemic in the (B) first year and (C) second year after the introduction of the vaccine, given one-dose vaccine coverage estimates and assuming 50 to 100% relative effectiveness. (D) Time series of model predictions for effect of vaccination (introduced in 2006) on the incidence of laboratory-confirmed rotavirus (blue), assuming vaccine coverage (red) remains at its current level (~68% with one dose, with 70% relative effectiveness).
Fig. 4
Fig. 4
Population dynamic impact of vaccination. Vaccination was included in the model assuming coverage (c) between 0 and 100% and age at immunization of 0 (blue), 4 (green), or 8 (red) months of age (comparable to assuming acquisition of immunity after first, second, or last dose of the vaccine). Plots show the effect of vaccination predicted by the model 10 years after the vaccine is introduced on (A) the average incidence of severe diarrhea, (B) the prevalence of symptomatic and asymptomatic infection, (C) the average age of severe diarrhea cases, and (D) the timing of epidemics relative to the pre-vaccination timing. The dots represent the model-predicted timing, while the lines represent the fitted relationship for coverage = 0 to 70%. Note that epidemics occur biennially when vaccination coverage exceeds 70%. The dotted black lines in (A) and (B) represent the direct effect of vaccination assuming immunization at birth.

Comment in

References

    1. Kapikian AZ, Chanock RM. In: Fields Virology. Fields BN, et al., editors. Vol. 2. Lippincott-Raven; Philadelphia: 2001. pp. 1657–1708.
    1. Parashar UD, Gibson CJ, Bresse JS, Glass RI. Emerg Infect Dis. 2006;12:304. - PMC - PubMed
    1. Parashar UD, Hummelman EG, Bresee JS, Miller MA, Glass RI. Emerg Infect Dis. 2003;9:565. - PMC - PubMed
    1. Fischer TK, et al. J Infect Dis. 2007;195:1117. - PubMed
    1. Glass RI, Parashar UD. N Engl J Med. 2006;354:75. - PubMed

Publication types

MeSH terms