

Atrial septopulmonary bundle of the posterior left atrium provides a substrate for atrial fibrillation initiation in a model of vagally mediated pulmonary vein tachycardia of the structurally normal heart
- PMID: 19609369
- PMCID: PMC2710853
- DOI: 10.1161/CIRCEP.107.760447
Atrial septopulmonary bundle of the posterior left atrium provides a substrate for atrial fibrillation initiation in a model of vagally mediated pulmonary vein tachycardia of the structurally normal heart
Abstract
Background: The posterior left atrium (PLA) and pulmonary veins (PVs) have been shown to be critical for atrial fibrillation (AF) initiation. However, the detailed mechanisms of reentry and AF initiation by PV impulses are poorly understood. We hypothesized that PV impulses trigger reentry and AF by undergoing wavebreaks as a result of sink-to-source mismatch at specific PV-PLA transitions along the septopulmonary bundle, where there are changes in thickness and fiber direction.
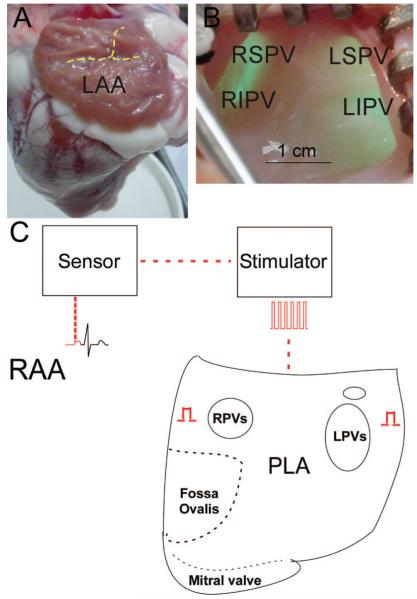
Methods and results: In 7 Langendorff-perfused sheep hearts AF was initiated by a burst of 6 pulses (CL 80 to 150ms) delivered to the left inferior or right superior PV ostium 100 to 150 ms after the sinus impulse in the presence of 0.5 micromol/L acetylcholine. The exposed septal-PLA endocardial area was mapped with high spatio-temporal resolution (DI-4-ANEPPS, 1000-fr/s) during AF initiation. Isochronal maps for each paced beat preceding AF onset were constructed to localize areas of conduction delay and block. Phase movies allowed the determination of the wavebreak sites at the onset of AF. Thereafter, the PLA myocardial wall thickness was quantified by echocardiography, and the fiber direction in the optical field of view was determined after peeling off the endocardium. Finally, isochrone, phase and conduction velocity maps were superimposed on the corresponding anatomic pictures for each of the 28 episodes of AF initiation. The longest delays of the paced PV impulses, as well as the first wavebreak, occurred at those boundaries along the septopulmonary bundle that showed sharp changes in fiber direction and the largest and most abrupt increase in myocardial thickness.
Conclusion: Waves propagating from the PVs into the PLA originating from a simulated PV tachycardia triggered reentry and vagally mediated AF by breaking at boundaries along the septopulmonary bundle where abrupt changes in thickness and fiber direction resulted in sink-to-source mismatch and low safety for propagation.
Keywords: atrial thickness; electrophysiology; fiber direction; mapping; reentry.
Figures


Similar articles
-
Intrinsic left atrial histoanatomy as the basis for reentrant excitation causing atrial fibrillation/flutter in rats.Heart Rhythm. 2013 Sep;10(9):1342-8. doi: 10.1016/j.hrthm.2013.04.021. Epub 2013 May 14. Heart Rhythm. 2013. PMID: 23680896
-
Acute vagal modulation of electrophysiology of the atrial and pulmonary veins increases vulnerability to atrial fibrillation.Exp Physiol. 2011 Feb;96(2):125-33. doi: 10.1113/expphysiol.2010.053280. Epub 2010 Oct 15. Exp Physiol. 2011. PMID: 20952490
-
Neural substrate for atrial fibrillation: implications for targeted parasympathetic blockade in the posterior left atrium.Am J Physiol Heart Circ Physiol. 2008 Jan;294(1):H134-44. doi: 10.1152/ajpheart.00732.2007. Epub 2007 Nov 2. Am J Physiol Heart Circ Physiol. 2008. PMID: 17982017
-
Pulmonary veins: anatomy, electrophysiology, tachycardia, and fibrillation.Pacing Clin Electrophysiol. 2004 Nov;27(11):1547-59. doi: 10.1111/j.1540-8159.2004.00675.x. Pacing Clin Electrophysiol. 2004. PMID: 15546312 Review.
-
Ionic and substrate mechanism of atrial fibrillation: rotors and the exitación frequency approach.Arch Cardiol Mex. 2010 Oct-Dec;80(4):301-14. Arch Cardiol Mex. 2010. PMID: 21169095 Free PMC article. Review.
Cited by
-
Rotors as drivers of atrial fibrillation and targets for ablation.Curr Cardiol Rep. 2014 Aug;16(8):509. doi: 10.1007/s11886-014-0509-0. Curr Cardiol Rep. 2014. PMID: 24950671 Free PMC article. Review.
-
Identification of regions maintaining atrial fibrillation through cycle length and cycle length gradient mapping.J Arrhythm. 2024 Sep 27;40(6):1389-1399. doi: 10.1002/joa3.13151. eCollection 2024 Dec. J Arrhythm. 2024. PMID: 39669931 Free PMC article.
-
Mechanisms and Drug Development in Atrial Fibrillation.Pharmacol Rev. 2018 Jul;70(3):505-525. doi: 10.1124/pr.117.014183. Pharmacol Rev. 2018. PMID: 29921647 Free PMC article. Review.
-
Novel approaches to mechanism-based atrial fibrillation ablation.Cardiovasc Res. 2021 Jun 16;117(7):1662-1681. doi: 10.1093/cvr/cvab108. Cardiovasc Res. 2021. PMID: 33744913 Free PMC article. Review.
-
A mathematical model of the unidirectional block caused by the pulmonary veins for anatomically induced atrial reentry.J Biol Phys. 2014 Jun;40(3):219-58. doi: 10.1007/s10867-014-9340-5. Epub 2014 May 2. J Biol Phys. 2014. PMID: 24789612 Free PMC article.
References
-
- Wattigney WA, Mensah GA, Croft JB. Increased atrial fibrillation mortality: United States, 1980-1998. Am J Epidemiol. 2002;155:819–826. - PubMed
-
- Oral H, Pappone C, Chugh A, Good E, Bogun F, Pelosi F, Jr, Bates ER, Lehmann MH, Vicedomini G, Augello G, Agricola E, Sala S, Santinelli V, Morady F. Circumferential pulmonary-vein ablation for chronic atrial fibrillation. N Engl J Med. 2006;354:934–941. - PubMed
-
- Chugh A, Ozaydin M, Scharf C, Lai SW, Hall B, Cheung P, Pelosi F, Jr, Knight BP, Morady F, Oral H. Mechanism of immediate recurrences of atrial fibrillation after restoration of sinus rhythm. Pacing Clin Electrophysiol. 2004;27:77–82. - PubMed
-
- Lu TM, Tai CT, Hsieh MH, Tsai CF, Lin YK, Yu WC, Tsao HM, Lee SH, Ding YA, Chang MS, Chen SA. Electrophysiologic characteristics in initiation of paroxysmal atrial fibrillation from a focal area. J Am Coll Cardiol. 2001;37:1658–1664. - PubMed
-
- Haissaguerre M, Jais P, Shah DC, Takahashi A, Hocini M, Quiniou G, Garrigue S, Le Mouroux A, Le Metayer P, Clementy J. Spontaneous initiation of atrial fibrillation by ectopic beats originating in the pulmonary veins. N Engl J Med. 1998;339:659–666. - PubMed
Publication types
MeSH terms
Grants and funding
LinkOut - more resources
Full Text Sources
Medical
Research Materials
