

A systems biology-based gene expression classifier of glioblastoma predicts survival with solid tumors
- PMID: 19609451
- PMCID: PMC2707631
- DOI: 10.1371/journal.pone.0006274
A systems biology-based gene expression classifier of glioblastoma predicts survival with solid tumors
Abstract
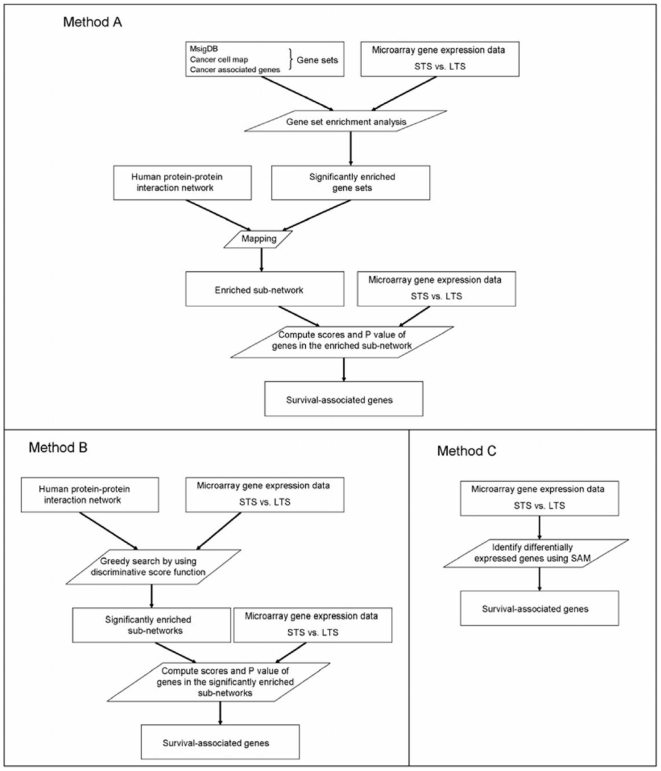
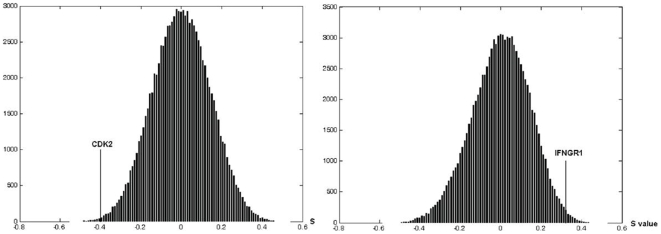
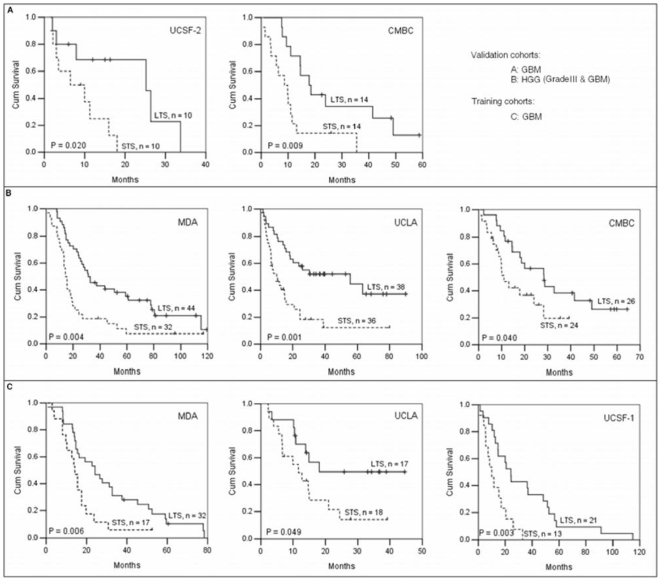
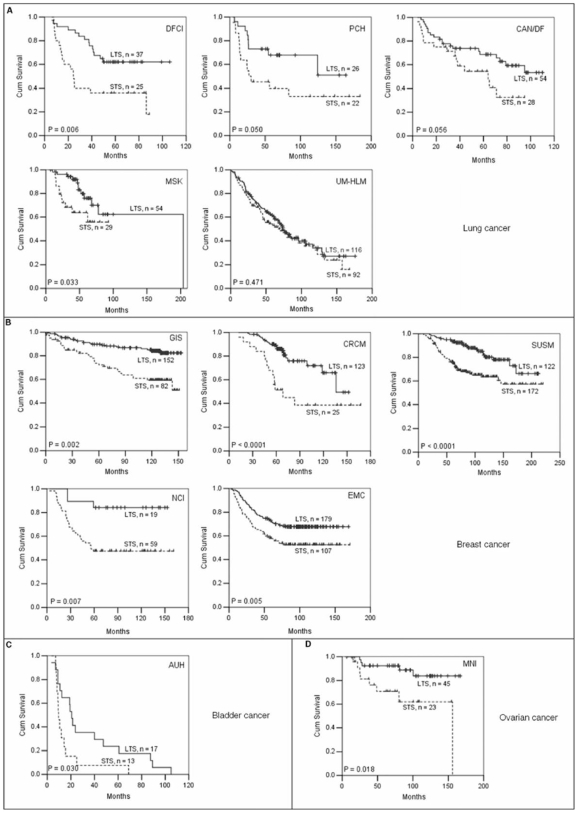
Accurate prediction of survival of cancer patients is still a key open problem in clinical research. Recently, many large-scale gene expression clusterings have identified sets of genes reportedly predictive of prognosis; however, those gene sets shared few genes in common and were poorly validated using independent data. We have developed a systems biology-based approach by using either combined gene sets and the protein interaction network (Method A) or the protein network alone (Method B) to identify common prognostic genes based on microarray gene expression data of glioblastoma multiforme and compared with differential gene expression clustering (Method C). Validations of prediction performance show that the 23-prognostic gene classifier identified by Method A outperforms other gene classifiers identified by Methods B and C or previously reported for gliomas on 17 of 20 independent sample cohorts across five tumor types. We also find that among the 23 genes are 21 related to cellular proliferation and two related to response to stress/immune response. We further find that the increased expression of the 21 genes and the decreased expression of the other two genes are associated with poorer survival, which is supportive with the notion that cellular proliferation and immune response contribute to a significant portion of predictive power of prognostic classifiers. Our results demonstrate that the systems biology-based approach enables to identify common survival-associated genes.
Conflict of interest statement
Figures
References
-
- Prados MD, Levin V. Biology and treatment of malignant glioma. Semin Oncol. 2000;27:1–10. - PubMed
-
- Nutt CL, Mani DR, Betensky RA, Tamayo P, Cairncross JG, et al. Gene expression-based classification of malignant gliomas correlates better with survival than histological classification. Cancer Res. 2003;63:1602–1607. - PubMed
-
- Freije WA, Castro-Vargas FE, Fang Z, Horvath S, Cloughesy T, et al. Gene expression profiling of gliomas strongly predicts survival. Cancer Res. 2004;64:6503–6510. - PubMed
-
- Phillips HS, Kharbanda S, Chen R, Forrest WF, Soriano RH, et al. Molecular subclasses of high-grade glioma predict prognosis, delineate a pattern of disease progression, and resemble stages in neurogenesis. Cancer Cell. 2006;9:157–173. - PubMed
-
- Ohgaki H, Dessen P, Jourde B, Horstmann S, Nishikawa T, et al. Genetic pathways to glioblastoma: a population-based study. Cancer Res. 2004;64:6892–6899. - PubMed
Publication types
MeSH terms
LinkOut - more resources
Full Text Sources
Other Literature Sources
Medical
