. 2010 Jan 15;58(2):218-30.
doi: 10.1002/glia.20918.

Different astroglia permissivity controls the migration of olfactory bulb interneuron precursors

Affiliations

Different astroglia permissivity controls the migration of olfactory bulb interneuron precursors

Jorge García-Marqués et al. Glia. .

Abstract

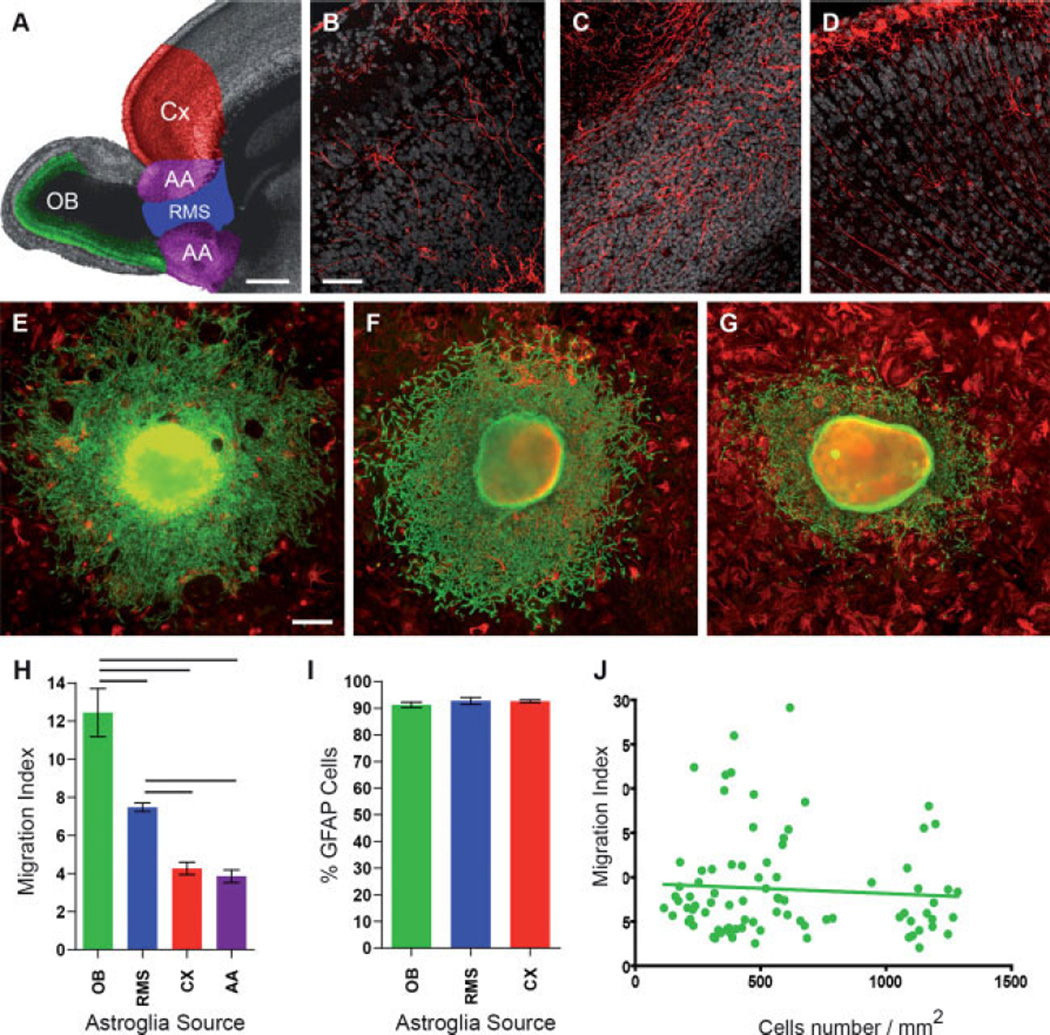
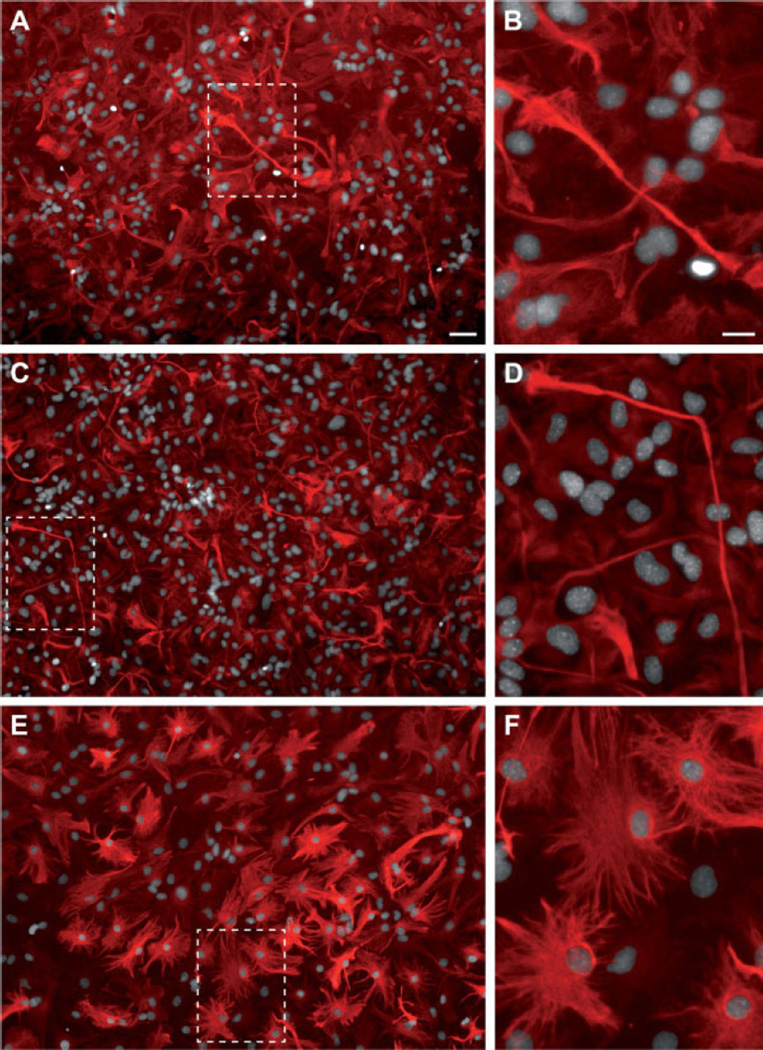
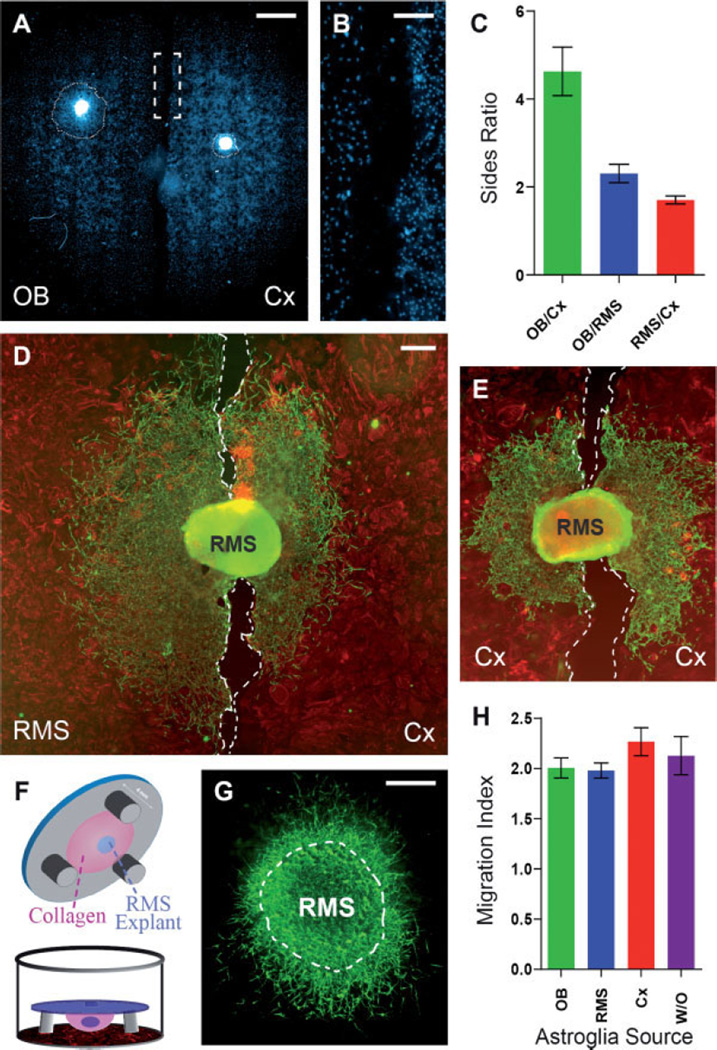
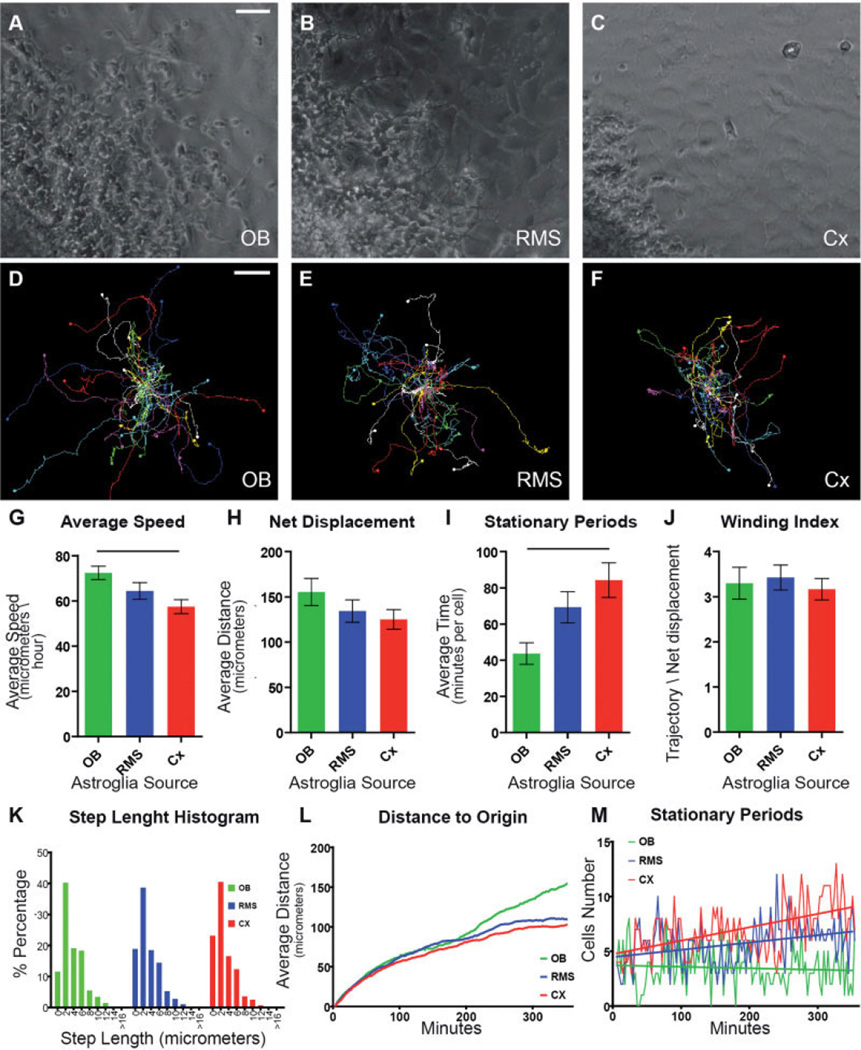
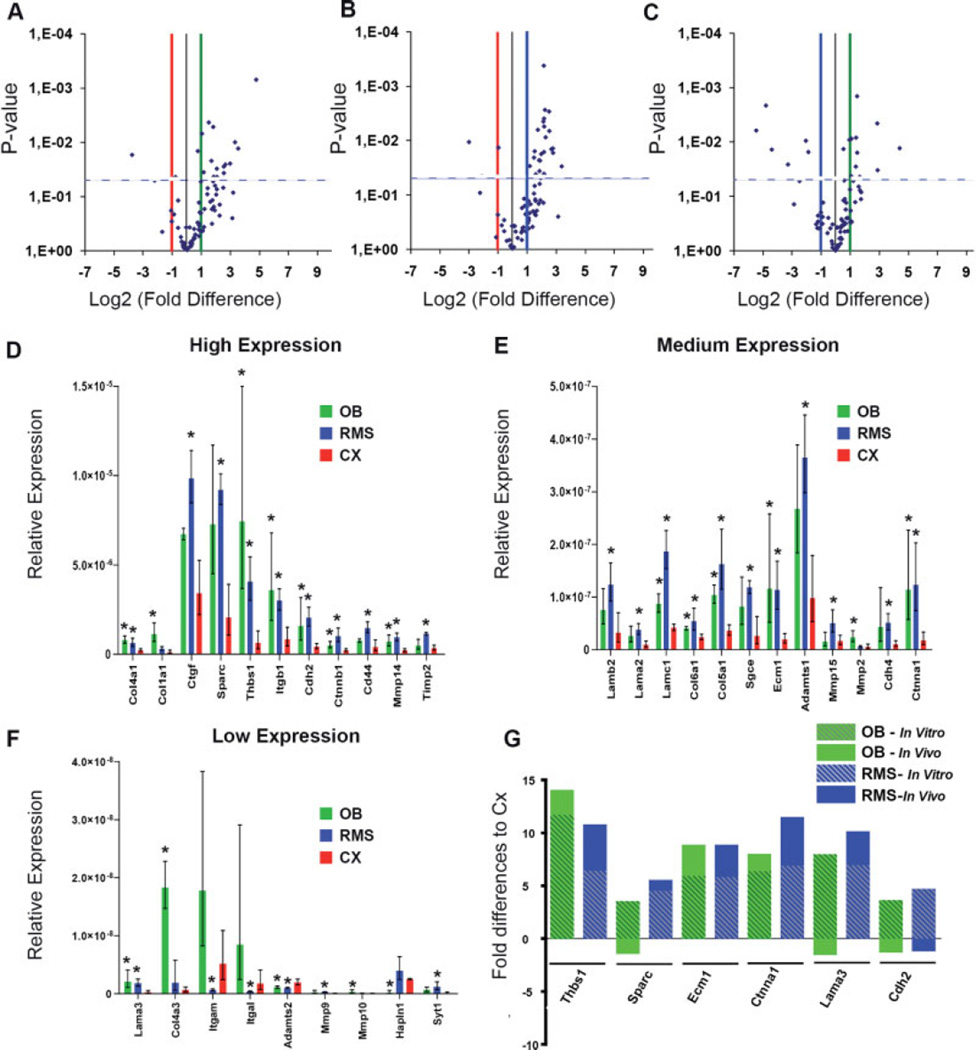
The rostral migratory stream (RMS) is a well defined migratory pathway for precursors of olfactory bulb (OB) interneurons. Throughout the RMS an intense astroglial matrix surrounds the migratory cells. However, it is not clear to what extent the astroglial matrix participates in migration. Here, we have analyzed the migratory behavior of neuroblasts cultured on monolayers of astrocytes isolated from areas that are permissive (RMS and OB) and nonpermissive (cortex and adjacent cortical areas) to migration. Our results demonstrate robust neuroblast migration when RMS-explants are cultured on OB or RMS-astrocytes, in contrast to their behavior on astroglia derived from nonpermissive areas. These differences, mediated by astrocyte-derived nonsoluble factors, are related to the overexpression of extracellular matrix and cell adhesion molecules, as revealed by real-time qRT-PCR. Our results show that astroglia heterogeneity could play a significant role in migration within the RMS and in cell detachment in the OB.


Figures

Fig. 1
Fig. 1
RMS-explants cultured on astrocyte monolayers derived from permissive (RMS, OB) and nonpermissive areas (frontal Cx and other adjacent RMS regions). (A) Shaded areas indicate the regions removed to generate the different astrocyte monolayers. (B–D) Immunohistochemistry for GFAP in sagittal sections at P2 (cell nuclei counterstained with bisbenzimide are shown in grey) from the OB (B), RMS (C) and CX (D). (E–G) Neuroblasts migrating from a RMS-explant (TuJ1, green) on astrocyte monolayers (GFAP, red) from OB (E), RMS (F) and Cx (G). (H) Neuroblast M.I. is statistically higher in those cells cultured on OB and RMS-derived-astrocytes than in those cultured on astrocytes from adjacent areas (where neuroblast migration does not occur in vivo). (I) Graph illustrates the percentage of GFAP-positive cells in the astrocyte monolayers, showing a minimum of 91% astrocytes in the different monolayers. (J) Linear correlation analysis between cell density and M.I., showing no co-relation between both parameters. Horizontal lines between groups indicate significant differences. Error bars show SEM. Scale bar = 400 µm in A; 50 µm for B–D; 200 µm for E–G.
Fig. 2
Fig. 2
Morphologies of astrocytes from different origins immunostained with anti-GFAP. (A,B) OB. (C,D) RMS. (E,F) Cx. OB- and RMS-astrocytes show bipolar morphology while Cx-astrocytes have a stellate and flat morphology. Scale bar = 50 for A, C, E; 20 µm for B, D, F.
Fig. 3
Fig. 3
Differences in neuroblast migration on different astrocyte monolayers are not mediated by soluble factors. (A) Two-explants cultured on different astrocytes sources stained with bisbezimide. Dotted lines delimited the migration limits for each explant. (B) Dotted square in (A) shows the free cell line between the different astrocytes sources. (C) Graph corresponding to the neuroblast migration ratio between two RMS-explants plated on two different astrocyte monolayers in the same well. (D) RMS-explant cultured at the boundary between RMS and Cx-astrocytes stained for Tuj1 (green) and GFAP (red). Note the difference in migration is maintained even when the RMS-explant is positioned in between different astrocyte monolayers. (E) RMS-explant plated in between two different Cx astrocyte monolayers. Note there are no significant differences in the migratory area. (F) Cartoon representing co-cultured RMS-explants on collagen over astrocyte monolayers. (G) RMS-explant co-cultured in collagen over astrocytes stained with anti-TuJ1. (H) Comparison of the migration index in the collagen co-culture on different astrocyte monolayers. W/O indicates assay without astrocytes. Error bars show SEM. Scale bar = 1.5 mm in A; 300 µm in B; 200 µm for D-E; 100 µm in G.
Fig. 4
Fig. 4
Time-lapse videomicroscopy of RMS-explants cultured on different astrocyte monolayers. (A–C) Neuroblast migration on astrocyte monolayers from OB (A), RMS (B) and Cx (C). The extension of cell migration is greater in OB- and RMS-derived astrocytes than on Cx-astrocytes. (D–F) Individual cell trajectories plotted over the last 6 h of the culture and adjusted to a common origin point. (G) Average speed of cell migration during the 6-h period. (H) Average of the maximum distance traveled away from the explant during the 6-h period. (I) Average of the cell stationary periods during the 6 h. (J) Average of the ratio between the total distance covered and the maximum distance reached from the migratory origin. (K) Histogram of the step length shown in percentages. Each step is defined as 3-min period. (L) Graph showing the temporal average cell distance from the migration origin. (M) Graph represents the relationship between the number of paused cells and time. A linear regression analysis was used to evaluate the relationship between the number and the time of stopped cells. The slope was statistically non-zero for RMS and Cx-derived-astrocytes (P < 0.0001 in both cases), but not for OB-derived-astrocytes (P = 0.424). Horizontal lines between groups indicate significant differences. Error bars show SEM. Scale bar = 50 µm for A–C; 75 µm for D–F.
Fig. 5
Fig. 5
Comparative RT-PCR analysis of ECM and cell adhesion gene expression in the different astrocyte monolayers. (A–C) Graphs showing the P-value and the differences for each gene comparing OB vs. Cx-astrocytes (A), RMS vs. Cx-astrocytes (B) and RMS vs. OB-astrocytes (C). (D–F) Relative expression for high (D), medium (E) and low expressed (F) genes. (G) Correlated relative expression between in vivo and in vitro assays for some selected genes. Graph illustrates the differences in gene expression detected in cultured astrocytes from RMS, OB and Cx compared with freshly-dissected RMS, OB and Cx tissue by RT-PCR. Asterisks indicate significant differences with respect to Cx-astrocytes. Bars show data range.

Similar articles

Cited by

References

    1. Alves JA, Barone P, Engelender S, Froes MM, Menezes JR. Initial stages of radial glia astrocytic transformation in the early postnatal anterior subventricular zone. J Neurobiol. 2002;52:251–265. - PubMed
    1. Banker G, Goslin K, editors. Culturing nerve cells. Cambridge: MIT Press; 1991. p. 453.
    1. Belvindrah R, Hankel S, Walker J, Patton BL, Muller U. Beta1 integrins control the formation of cell chains in the adult rostral migratory stream. J Neurosci. 2007;27:2704–2717. - PMC - PubMed
    1. Blake SM, Strasser V, Andrade N, Duit S, Hofbauer R, Schneider WJ, Nimpf J. Thrombospondin-1 binds to ApoER2 and VLDL receptor and functions in postnatal neuronal migration. Embo J. 2008;27:3069–3080. - PMC - PubMed
    1. Bolteus AJ, Bordey A. GABA release and uptake regulate neuronal precursor migration in the postnatal subventricular zone. J Neurosci. 2004;24:7623–7631. - PMC - PubMed

Publication types

MeSH terms

Substances