Full-field acoustomammography using an acousto-optic sensor
- PMID: 19610321
- PMCID: PMC2832069
- DOI: 10.1118/1.3132273
Full-field acoustomammography using an acousto-optic sensor
Abstract
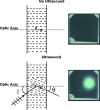
In this Letter the authors introduce a wide-field transmission ultrasound approach to breast imaging based on the use of a large area acousto-optic (AO) sensor. Accompanied by a suitable acoustic source, such a detector could be mounted on a traditional mammography system and provide a mammographylike ultrasound projection image of the compressed breast in registration with the x-ray mammogram. The authors call the approach acoustography. The hope is that this additional information could improve the sensitivity and specificity of screening mammography. The AO sensor converts ultrasound directly into a visual image by virtue of the acousto-optic effect of the liquid crystal layer contained in the AO sensor. The image is captured with a digital video camera for processing, analysis, and storage. In this Letter, the authors perform a geometrical resolution analysis and also present images of a multimodality breast phantom imaged with both mammography and acoustography to demonstrate the feasibility of the approach. The geometric resolution analysis suggests that the technique could readily detect tumors of diameter of 3 mm using 8.5 MHz ultrasound, with smaller tumors detectable with higher frequency ultrasound, though depth penetration might then become a limiting factor. The preliminary phantom images show high contrast and compare favorably to digital mammograms of the same phantom. The authors have introduced and established, through phantom imaging, the feasibility of a full-field transmission ultrasound detector for breast imaging based on the use of a large area AO sensor. Of course variations in attenuation of connective, glandular, and fatty tissues will lead to images with more cluttered anatomical background than those of the phantom imaged here. Acoustic coupling to the mammographically compressed breast, particularly at the margins, will also have to be addressed.
Figures


Similar articles
-
Stress field forming of sector array transducers for vibro-acoustography.IEEE Trans Ultrason Ferroelectr Freq Control. 2005 Nov;52(11):1943-51. doi: 10.1109/tuffc.2005.1561663. IEEE Trans Ultrason Ferroelectr Freq Control. 2005. PMID: 16422406
-
Laser optoacoustic imaging system for detection of breast cancer.J Biomed Opt. 2009 Mar-Apr;14(2):024007. doi: 10.1117/1.3086616. J Biomed Opt. 2009. PMID: 19405737
-
Acousto-optic interaction in a non-homogeneous acoustic field excited by a wedge-shaped transducer.Ultrasonics. 2008 Sep;48(5):351-6. doi: 10.1016/j.ultras.2008.01.001. Epub 2008 Jan 16. Ultrasonics. 2008. PMID: 18291434
-
Backward-mode multiwavelength photoacoustic scanner using a planar Fabry-Perot polymer film ultrasound sensor for high-resolution three-dimensional imaging of biological tissues.Appl Opt. 2008 Feb 1;47(4):561-77. doi: 10.1364/ao.47.000561. Appl Opt. 2008. PMID: 18239717
-
Calculation of strain images of a breast-mimicking phantom from 3D CT image data.Med Phys. 2012 Sep;39(9):5469-78. doi: 10.1118/1.4742902. Med Phys. 2012. PMID: 22957614
Cited by
-
Acousto-Optics: Recent Studies and Medical Applications.Biosensors (Basel). 2023 Jan 25;13(2):186. doi: 10.3390/bios13020186. Biosensors (Basel). 2023. PMID: 36831952 Free PMC article. Review.
-
Feasibility study of complex wavefield retrieval in off-axis acoustic holography employing an acousto-optic sensor.Ultrasonics. 2011 Dec;51(8):847-52. doi: 10.1016/j.ultras.2011.05.002. Epub 2011 May 11. Ultrasonics. 2011. PMID: 21669451 Free PMC article.
-
TRANSDUCER FIELD IMAGING USING ACOUSTOGRAPHY.Adv Acoust Vib. 2012;2012:275858. doi: 10.1155/2012/275858. Adv Acoust Vib. 2012. PMID: 23967016 Free PMC article.
-
Radiomics in Differentiated Thyroid Cancer and Nodules: Explorations, Application, and Limitations.Cancers (Basel). 2021 May 18;13(10):2436. doi: 10.3390/cancers13102436. Cancers (Basel). 2021. PMID: 34069887 Free PMC article. Review.
References
-
- American Cancer Society, Cancer Facts and Figures (American Cancer Society, Atlanta, 2008).
-
- Humphrey L. L., Helfand M., Chan B. K., and Woolf S. H., “Breast cancer screening: A summary of the evidence for the U.S. Preventive Services Task Force,” Ann. Intern. Med. 137, 347–360 (2002). - PubMed
-
- Pisano E. D., Gatsonis C., Hendrick E., Yaffe M., Baum J. K., Acharyya S., Conant E. F., Fajardo L. L., Bassett L., D’Orsi C., Jong R., and Rebner M., “Diagnostic performance of digital versus film mammography for breast-cancer screening,” N. Engl. J. Med. NEJMAG 353, 1773–1783 (2005).10.1056/NEJMoa052911 - DOI - PubMed
-
- Rosenberg R. D., Yankaskas B. C., Abraham L. A., Sickles E. A., Lehman C. D., Geller B. M., Carney P. A., Kerlikowske K., Buist D. S. M., Weaver D. L., Barlow W. E., and Ballard-Barbash R., “Performance benchmarks for screening mammography,” Radiology RADLAX 241, 55–66 (2006).10.1148/radiol.2411051504 - DOI - PubMed
-
- Dines K. A., Kelly-Fry E., and Romilly A. P., “Mammography method and apparatus,” U.S. Patent No. 6,876,879 B2 (April 5, 2005).
Publication types
MeSH terms
Grants and funding
LinkOut - more resources
Full Text Sources
Miscellaneous

