

Saxagliptin added to a submaximal dose of sulphonylurea improves glycaemic control compared with uptitration of sulphonylurea in patients with type 2 diabetes: a randomised controlled trial
- PMID: 19614786
- PMCID: PMC2779994
- DOI: 10.1111/j.1742-1241.2009.02143.x
Saxagliptin added to a submaximal dose of sulphonylurea improves glycaemic control compared with uptitration of sulphonylurea in patients with type 2 diabetes: a randomised controlled trial
Erratum in
- Int J Clin Pract. 2010 Jan;64(2):277
Abstract
Aims: Assess the efficacy and safety of saxagliptin added to a submaximal sulphonylurea dose vs. uptitration of sulphonylurea monotherapy in patients with type 2 diabetes and inadequate glycaemic control with sulphonylurea monotherapy.
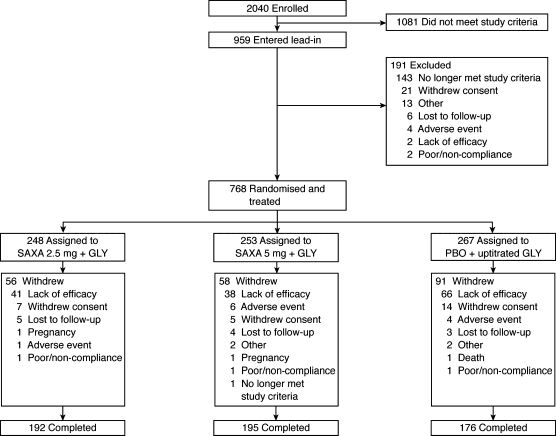
Methods and patients: A total of 768 patients (18-77 years; HbA(1c) screening >or= 7.5 to <or= 10.0%) were randomised and treated with saxagliptin 2.5 or 5 mg in combination with glyburide 7.5 mg vs. glyburide 10 mg for 24 weeks. Blinded uptitration glyburide was allowed in the glyburide-only arm to a maximum total daily dose of 15 mg. Efficacy analyses were performed using ANCOVA and last-observation-carried-forward methodology.
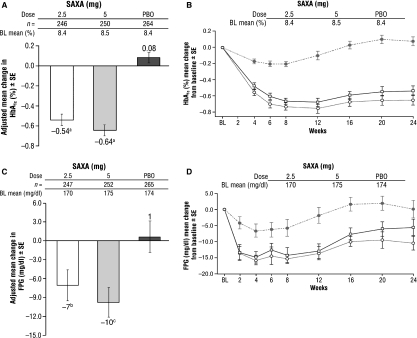
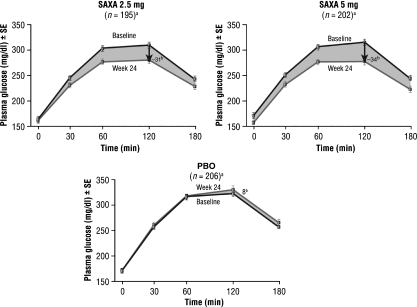
Results: At week 24, 92% of glyburide-only patients were uptitrated to a total glyburide dose of 15 mg/day. Saxagliptin 2.5 and 5 mg provided statistically significant adjusted mean decreases from baseline to week 24 vs. uptitrated glyburide, respectively, in HbA(1c) (-0.54%, -0.64% vs. +0.08%; both p < 0.0001) and fasting plasma glucose (-7, -10 vs. +1 mg/dl; p = 0.0218 and p = 0.002). The proportion of patients achieving an HbA(1c) < 7% was greater for saxagliptin 2.5 and 5 mg vs. uptitrated glyburide (22.4% and 22.8% vs. 9.1%; both p < 0.0001). Postprandial glucose area under the curve was reduced for saxagliptin 2.5 and 5 mg vs. uptitrated glyburide (-4296 and -5000 vs. +1196 mg.min/dl; both p < 0.0001). Adverse event occurrence was similar across all groups. Reported hypoglycaemic events were not statistically significantly different for saxagliptin 2.5 (13.3%) and 5 mg (14.6%) vs. uptitrated glyburide (10.1%).
Conclusion: Saxagliptin added to submaximal glyburide therapy led to statistically significant improvements vs. uptitration of glyburide alone across key glycaemic parameters and was generally well tolerated.
Trial registration: ClinicalTrials.gov NCT00313313.
Figures
References
-
- Butler AE, Janson J, Bonner-Weir S, Ritzel R, Rizza RA, Butler PC. β-Cell deficit and increased β-cell apoptosis in humans with type 2 diabetes. Diabetes. 2003;52:102–10. - PubMed
-
- Turner RC, Cull CA, Frighi V, Holman RR. Glycemic control with diet, sulfonylurea, metformin, or insulin in patients with type 2 diabetes mellitus: progressive requirement for multiple therapies (UKPDS 49). UK Prospective Diabetes Study (UKPDS) Group. JAMA. 1999;281:2005–12. - PubMed
-
- Kahn SE, Haffner SM, Heise MA, et al. Glycemic durability of rosiglitazone, metformin, or glyburide monotherapy. N Engl J Med. 2006;355:2427–43. - PubMed
-
- McAlister FA, Eurich DT, Majumdar SR, Johnson JA. The risk of heart failure in patients with type 2 diabetes treated with oral agent monotherapy. Eur J Heart Fail. 2008;10:703–8. - PubMed
-
- Asche CV, McAdam-Marx C, Shane-McWhorter L, Sheng X, Plauschinat CA. Association between oral and antidiabetic use, adverse events and outcomes in patients with type 2 diabetes. Diabetes Obes Metab. 2008;10:638–45. - PubMed
Publication types
MeSH terms
Substances
Associated data
LinkOut - more resources
Full Text Sources
Medical
Miscellaneous
