

Understanding measurements of intestinal permeability in healthy humans with urine lactulose and mannitol excretion
- PMID: 19614866
- PMCID: PMC2802677
- DOI: 10.1111/j.1365-2982.2009.01361.x
Understanding measurements of intestinal permeability in healthy humans with urine lactulose and mannitol excretion
Abstract
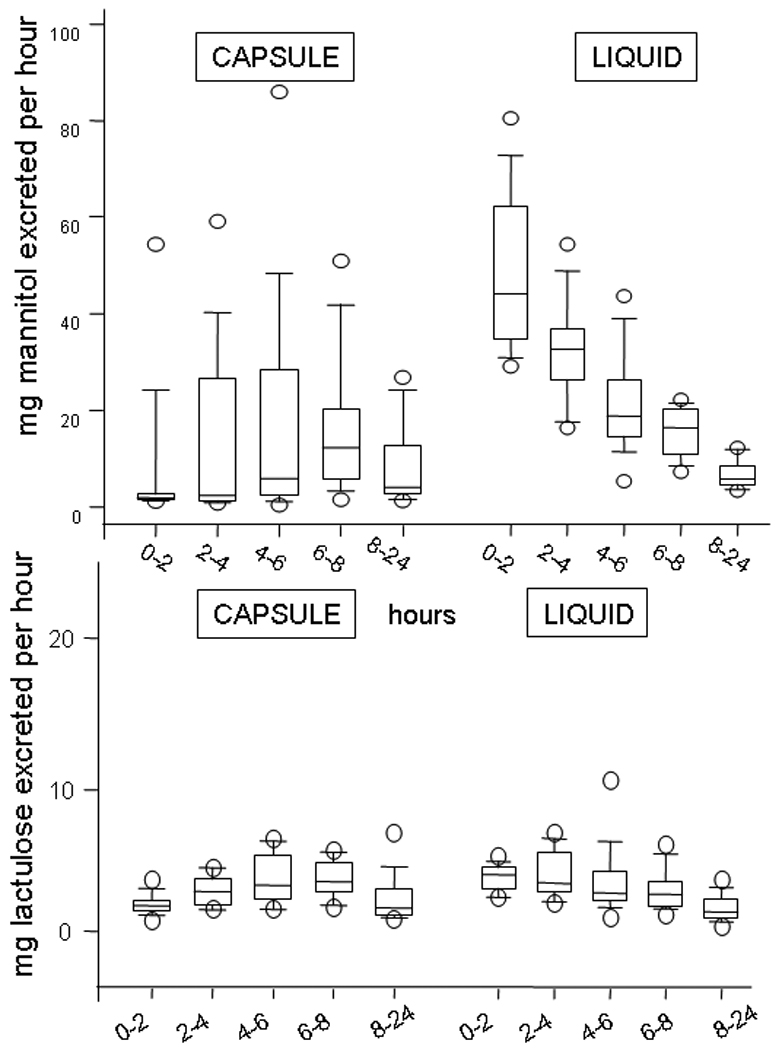
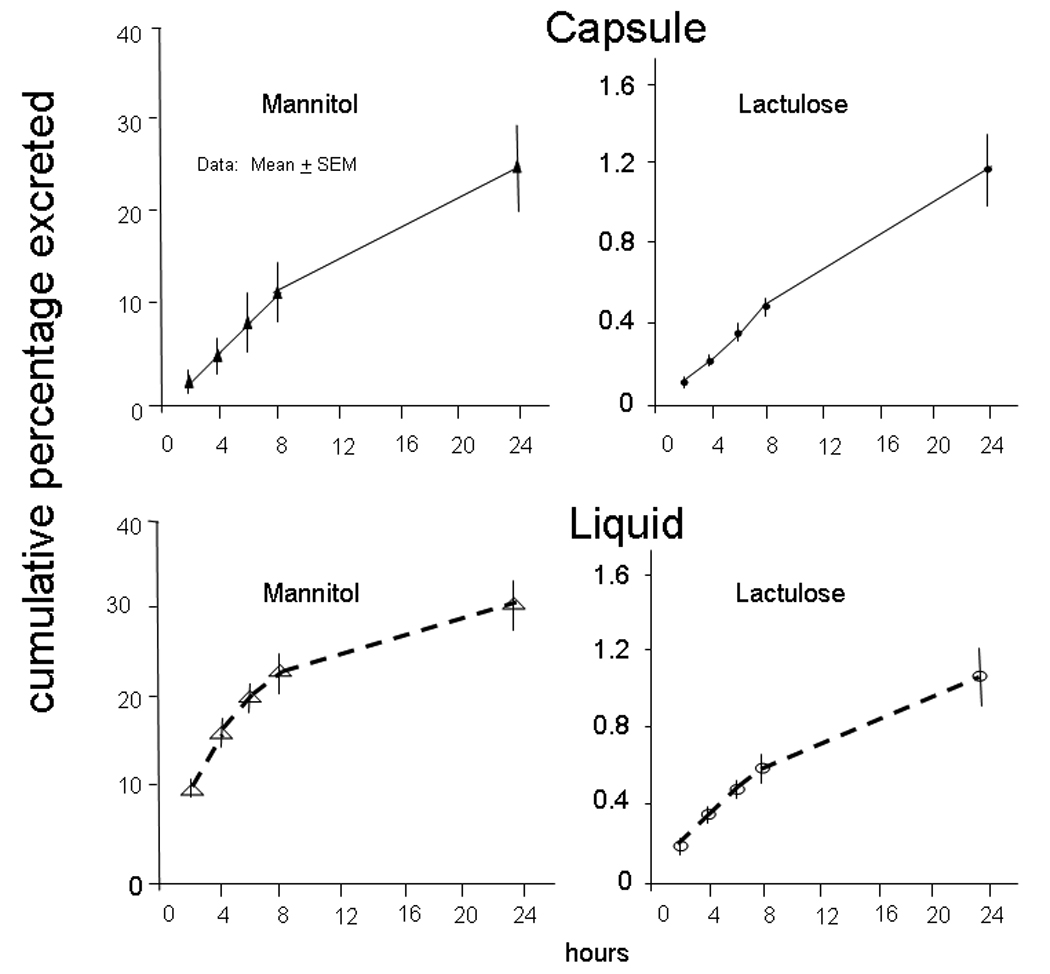
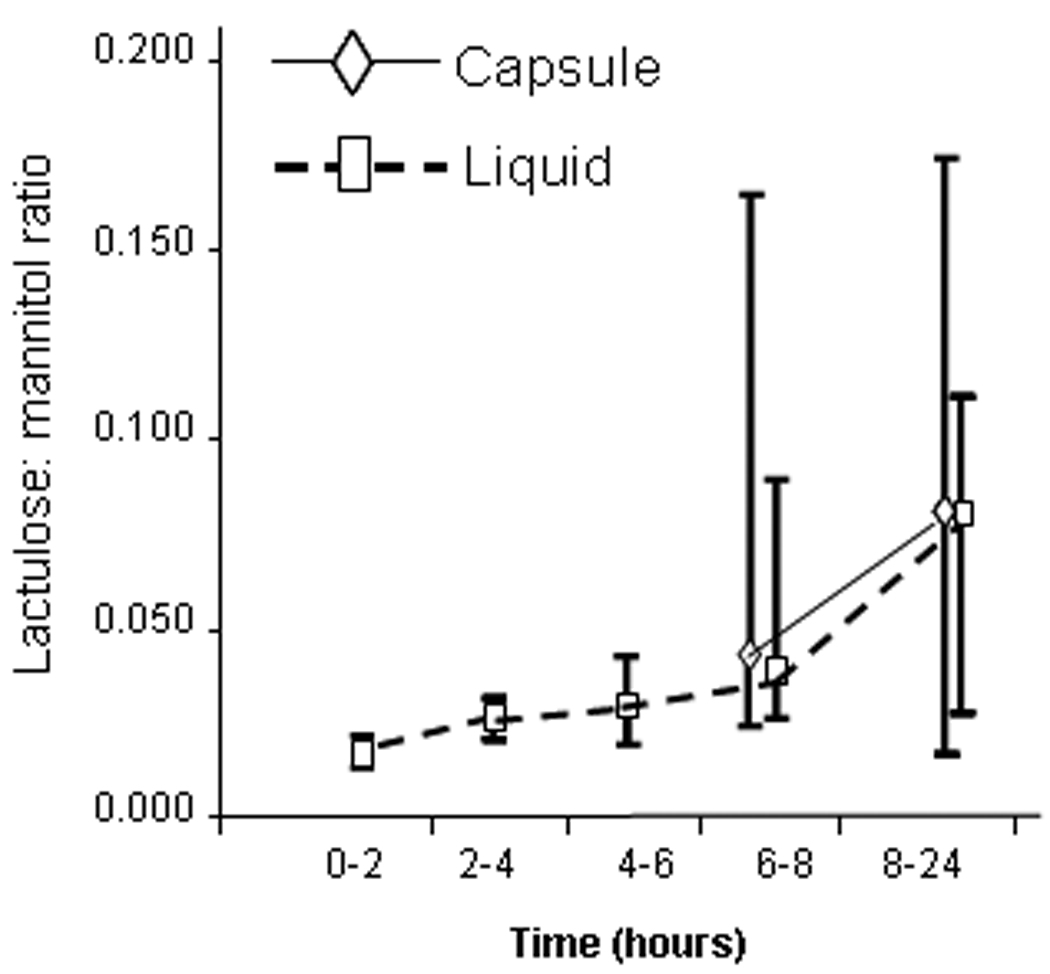
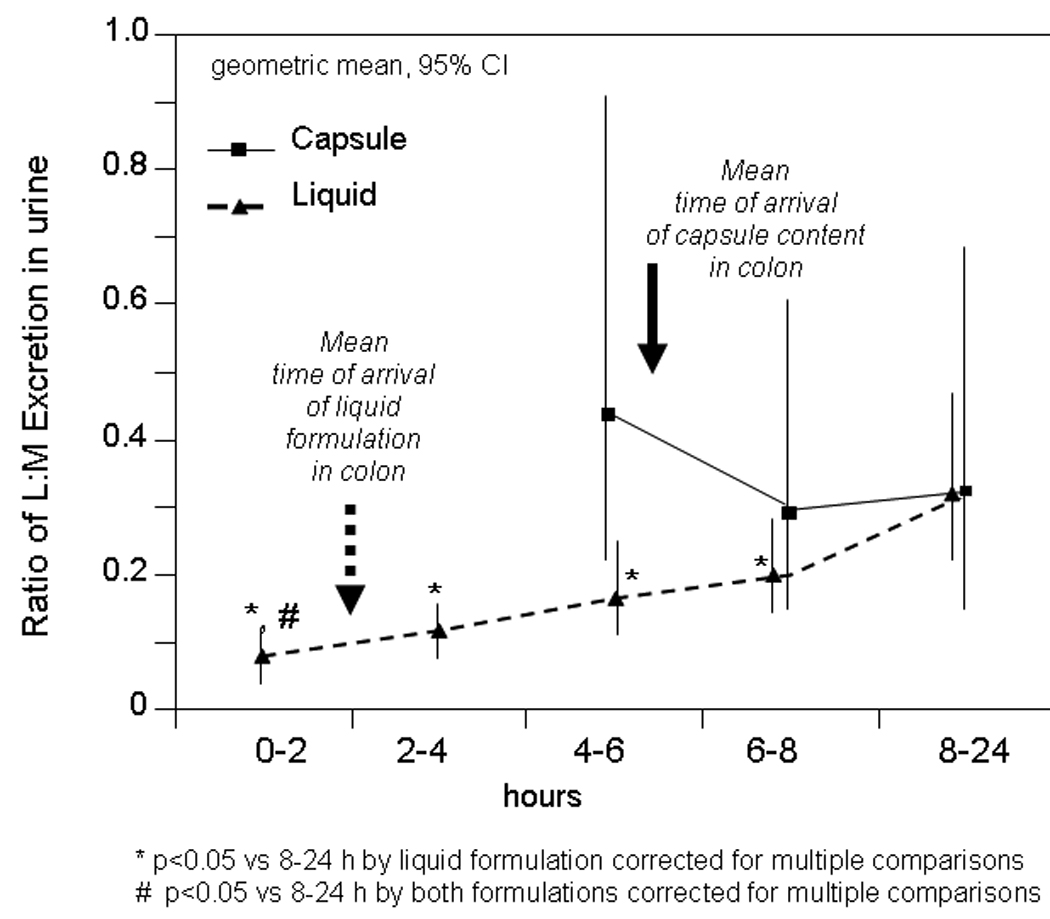
Our aim was to understand the information from differential two-sugar excretion (2-SE) in measuring intestinal permeability. In a crossover study in 12 healthy volunteers, we compared urinary excretion ratios of lactulose (L) to mannitol [(M) LMR] after ingestion in liquid formulation (LF) or in delayed-release, methacrylate-coated capsules (CAP). Both formulations were radiolabelled. Urine was collected every 2 h from 0 to 8 h, and from 8 to 24 h. Two hours after LF, gastric residual was 15.9 +/- 6.2% (SEM), and the percentage in colon was 49.6 +/- 7.8%; in 11/12 participants, liquid had entered colon within 2 h. Average CAP arrival time in colon was 5.16 +/- 0.46 h (mode 6 h). After LF, mannitol was extensively absorbed in the first 8 h; lactulose absorption was low throughout the 24 h. After the LF, the LMR (geometric mean, 95% CI per h) in the 0-2 h urine was [0.08 (0.05, 0.11)], which was lower than in 8-24 h urine [0.32 (0.16, 0.46); P < 0.05]. Urine LMRs at 8-24 h were similar after LF or CAP. We concluded that, after LF, sugar excretion in 0-2 h urine may reflect both SI and colon permeability. Colonic permeability is reflected by urine sugar excretion between 6 and 24 h. CAP delivery reduces mannitol excreted at 0-6 h, compared with LF. The 0-5 or 6 h 2-SE urine likely reflects both SI and colon permeability; the higher LMR in the 8-24 h urine relative to 0-2 h urine should be interpreted with caution and does not mean that colon is more permeable than SI.
Figures
References
-
- Porras M, Martin MT, Yang PC, Jury J, Perdue MH, Vergara P. Correlation between cyclical epithelial barrier dysfunction and bacterial translocation in the relapses of intestinal inflammation. Inflamm Bowel Dis. 2006;12:843–852. - PubMed
-
- Sun Z, Wang X, Andersson R. Role of intestinal permeability in monitoring mucosal barrier function. History, methodology, and significance of pathophysiology. Dig Surg. 1998;15:386–397. - PubMed
-
- Bjarnason I, MacPherson A, Hollander D. Intestinal permeability: an overview. Gastroenterology. 1995;108:1566–1581. - PubMed
-
- Camilleri M, Gorman H. Intestinal permeability and irritable bowel syndrome. Neurogastroenterol Motil. 2007;19:545–552. - PubMed
-
- Dunlop SP, Hebden J, Campbell E, Naesdal J, Olbe L, Perkins AC, Spiller RC. Abnormal intestinal permeability in subgroups of diarrhea-predominant irritable bowel syndromes. Am J Gastroenterol. 2006;101:1288–1294. - PubMed
Publication types
MeSH terms
Substances
Grants and funding
LinkOut - more resources
Full Text Sources
Miscellaneous
