Comparative Study
. 2009 Jul;30(2):327-38.
doi: 10.1111/j.1460-9568.2009.06819.x. Epub 2009 Jul 15.

Neural correlates of evaluative compared with passive tasting

Affiliations
Comparative Study

Neural correlates of evaluative compared with passive tasting

Genevieve Bender et al. Eur J Neurosci. 2009 Jul.

Abstract

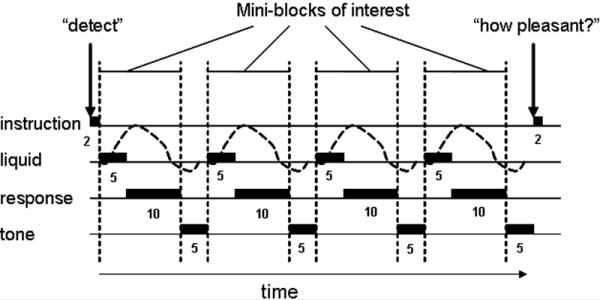
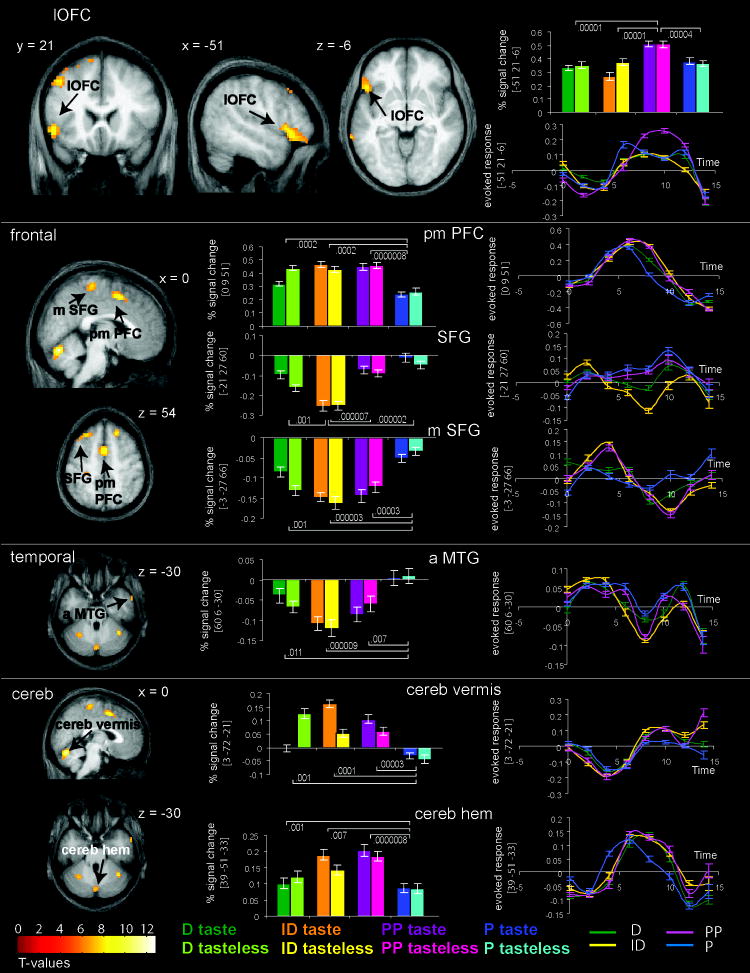
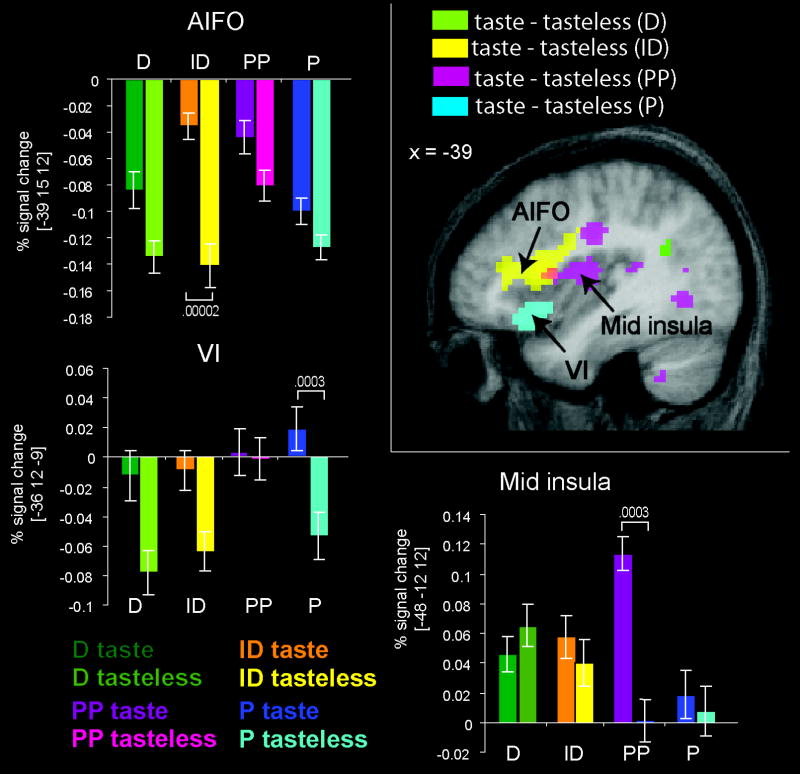
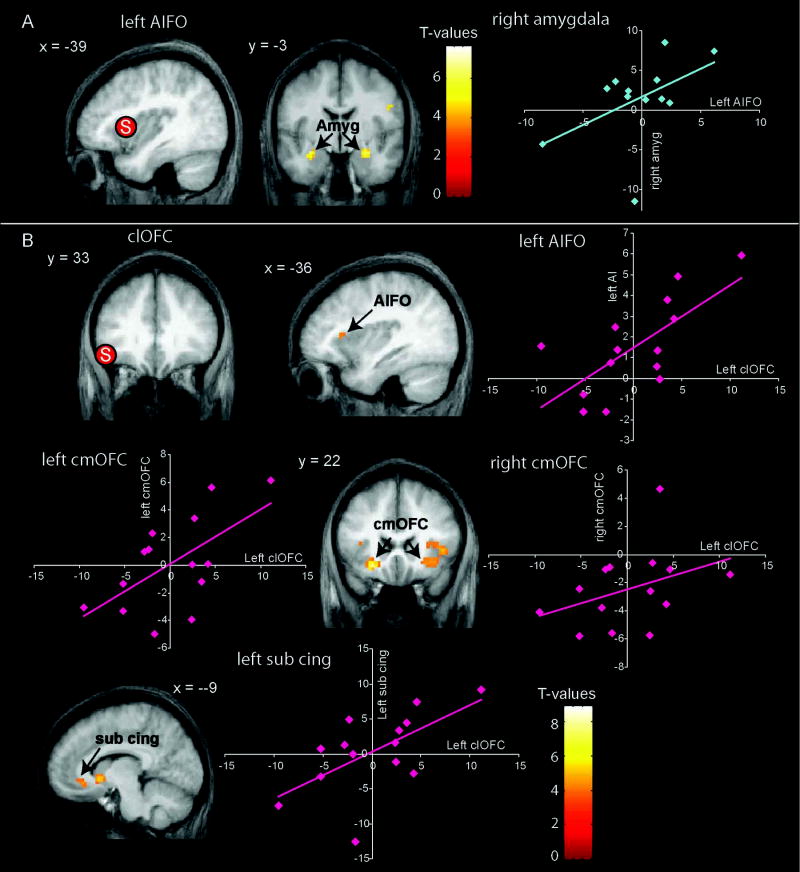
We used functional magnetic resonance imaging to test the hypothesis that the nature of the neural response to taste varies as a function of the task the subject is asked to perform. Subjects received sweet, sour, salty and tasteless solutions passively and while evaluating stimulus presence, pleasantness and identity. Within the insula and overlying operculum the location of maximal response to taste vs. tasteless varied as a function of task; however, the primary taste cortex (anterior dorsal insula/frontal operculum--AIFO), as well as a more ventral region of anterior insula, responded to taste vs. tasteless irrespective of task. Although the response here did not depend upon task, preferential connectivity between AIFO and the amygdala (bilaterally) was observed when subjects tasted passively compared with when they performed a task. This suggests that information transfer between AIFO and the amygdala is maximal during implicit processing of taste. In contrast, a region of the left lateral orbitofrontal cortex (OFC) responded preferentially to taste and to tasteless when subjects evaluated pleasantness, and was preferentially connected to earlier gustatory relays (caudomedial OFC and AIFO) when a taste was present. This suggests that processing in the lateral OFC organizes the retrieval of gustatory information from earlier relays in the service of computing perceived pleasantness. These findings show that neural encoding of taste varies as a function of task beyond that of the initial cortical representation.


Figures

Figure 1
Figure 1. Graphic depiction of long event-related design
A long-event related design was used. Three different taste stimuli (sweet, sour, salty) and one tasteless stimulus, with similar ionic components to saliva (O’Doherty et al., 2001), were delivered (indicted by “liquid”. Every event began with the delivery of 0.5 cc of liquid over a 5 second period. The liquid was held in the mouth until a 400Hz tone played for 5 s signaling the window of the time during which subjects were allowed to swallow. Responses to instructions were made on manually held controllers after stimulus delivery and before the onset of the swallow tone (indicated by “response”. The dotted line indicates the predicted hemodynamic response function. Tasks were performed in blocks that began with a 2 second instruction indicating the task condition (“Is there a taste” D; “What is the taste” ID; “How pleasant is the taste” PP; “Randomly press” P). The subject was instructed to respond to the same task condition over 4 trials before the instruction changed. All 4 task conditions were presented during a run and counterbalanced to account for order effects.
Figure 2
Figure 2. Main effect of stimulus
Brain sections (left column) show the location of the main effect of stimulus in the anterior insula/frontal operculum (AIFO) and ventral insula (VI) indicated with black arrows. The bar graphs (middle column) depict the average percent signal change over subjects (+/- s.e.m.) of the neural response at the peak voxel indicated by the arrows in the anatomical sections during perception of taste (light blue) and tasteless (dark blue) in each of the tasks (D = detection, ID = identification, PP = perceived pleasantness, and P = passive). Error bars represent standard error of the mean. The numbers represent uncorrected p-values extracted from contrasts of simple effects indicated by the lines. T-maps were thresholded at p < 0.001. Color bars represent t-values. Activation maps (and bar graphs) are based on the fit to the canonical HRF. The right column illustrates the time courses of the responses where response (in arbitrary units) to taste (dark blue) and to tasteless (light blue) are plotted as a function of time (in sec). Each time course represents the average response over subjects (+/- s.e.m.) extracted from the peak voxels. The hemodynamic response is estimated from the first eigenvariate at each TR (2 s.) in peristimulus time from the onset of the event until 7 scans after the event occurs. The responses are averaged across all occurrences of that event and averaged across tasks. Thus there is a data point at each 2 s interval. We note that the time course data may not correspond exactly with the bar graphs because the bar graphs reflected data fitted to the canonical HRF whereas the time courses are extracted using a finite impulse response model. These methods are standard within the spm_graph.m function.
Figure 3
Figure 3. Main effect of task
Brain sections illustrate the location of brain regions in which a main of effect of task is present. Each panel (delineated with a white line) is devoted to a particular region. From the top this includes the lateral orbitofrontal cortex (LOFC); frontal cortex, including the posterior medial prefrontal cortex (pmPFC), superior frontal gyrus (SFG), and medial superior frontal gyrus (mPFC); anterior middle temporal guyrs (aMTG); and cerebellum (Cereb), including the vermis and hemisphere (Hem). Bar graphs depict the average percent signal change over subjects (+/- s.e.m.) of the neural response at the peak voxel indicated by the arrows in the anatomical sections during perception of taste and tasteless (D = detection, ID = identification, PP = perceived pleasantness, and P = passive). The color key for the bar graphs is located at the bottom of the figure. The numbers represent uncorrected p-values extracted from contrasts of simple effects indicated by the lines. The line graphs depict time course data of response to tasting during each condition in arbitrary units (+/- s.e.m.) extracted from the peak voxel (y-axis) and plotted against time in seconds (x-axis). See legend of figure 3 for further details. T-maps were thresholded at p < 0.001. Color bars represent t-values.
Figure 4
Figure 4. Taste-tasteless as a function of task in the insula
The sagittal brain section depicts the location of response isolated in the contrast of taste – tasteless for each of the four conditions (ID = identification; PP = perceived pleasantness; P = passive; D = detect), color-coded and superimposed upon the mean anatomical image. The SPM t-maps were thresholded at p < 0.005 for the purpose of illustration Activations appearing outside of the insula and overlying opeculum in this image are not significant. Bar graphs depict the average percent signal change over subjects (+/- s.e.m.) of the neural response at the peak voxel indicated by the black arrow (y – axis) for taste and tasteless across the four tasks. The color key is located at the bottom of the figure. T-maps were thresholded at p < 0.001.
Figure 5
Figure 5. Connectivity analyses
(A) Psychophysiological interactions (PPIs) with the left anterior insula/frontal operculum (AIFO) seed region. The sagittal image on the left shows the location (indicated with “S”) of the seed region in left AIFO from which data were extracted to perform the PPI. The coronal section depicts regions of the amygdala (Amyg) where a significant PPI is observed, reflecting greater connectivity between the amygdala and AIFO during passive tasting compared to tasting while subjects perform a task (D, ID, PP). The graphs show the parameter estimates from AIFO (x-axis) plotted against the parameter estimates from the right amygdala (y-axis) extracted for each subject in the contrast P vs. (D+ID+PP). Thus each dot represents a single subject. Note that a PPI between the right insula and the left amygdala was also observed at a reduced threshold but is not depicted here. (B) PPIs with the left lateral orbitofrontal cortex (lOFC) seed region. The top left coronal section shows the location (indicated with “S”) of the seed region in lOFC from which data were extracted to perform a PPI. The remaining images depict regions where a significant PPI with the lOFC seed is observed, reflecting greater connectivity when subjects judge pleasantness of a taste compared to when they judge pleasantness of a tasteless solution. These regions include the left AIFO, left and right caudomedial OFC (cmOFC) and midline subcallosal cingulate (sub cing).. The graphs depict paremeter estimates extracted from the seed clOFC (x – axis) plotted against the parameter estimates from the peaks identified in the brain sections (y-axis). The color bars depict t-values. T-maps were thresholded at p < 0.001.

References

    1. Accolla R, Bathellier B, Petersen CC, Carleton A. Differential spatial representation of taste modalities in the rat gustatory cortex. J Neurosci. 2007;27:1396–1404. - PMC - PubMed
    1. Anderson AK, Christoff K, Stappen I, Panitz D, Ghahremani DG, Glover G, Gabrieli JDE, Sobel N. Dissociated neural representations of intensity and valence in human olfaction. Nat Neurosci. 2003;6:196–202. - PubMed
    1. Barry MA, Gatenby JC, Zeiger JD, Gore JC. Hemispheric dominance of cortical activity evoked by focal electrogustatory stimuli. Chem Senses. 2001;26:471–482. - PubMed
    1. Beckstead RM, Morse JR, Norgren R. The nucleus of the solitary tract in the monkey: projections to the thalamus and brain stem nuclei. J Comp Neurol. 1980;190:259–282. - PubMed
    1. Cerf-Ducastel B, Murphy C. Validation of a stimulation protocol suited to the investigation of odor-taste interactions with fMRI. Physiol & Behav. 2004;81:389–396. - PubMed

Publication types