

Open-source logic-based automated sleep scoring software using electrophysiological recordings in rats
- PMID: 19615408
- PMCID: PMC2761146
- DOI: 10.1016/j.jneumeth.2009.07.009
Open-source logic-based automated sleep scoring software using electrophysiological recordings in rats
Abstract
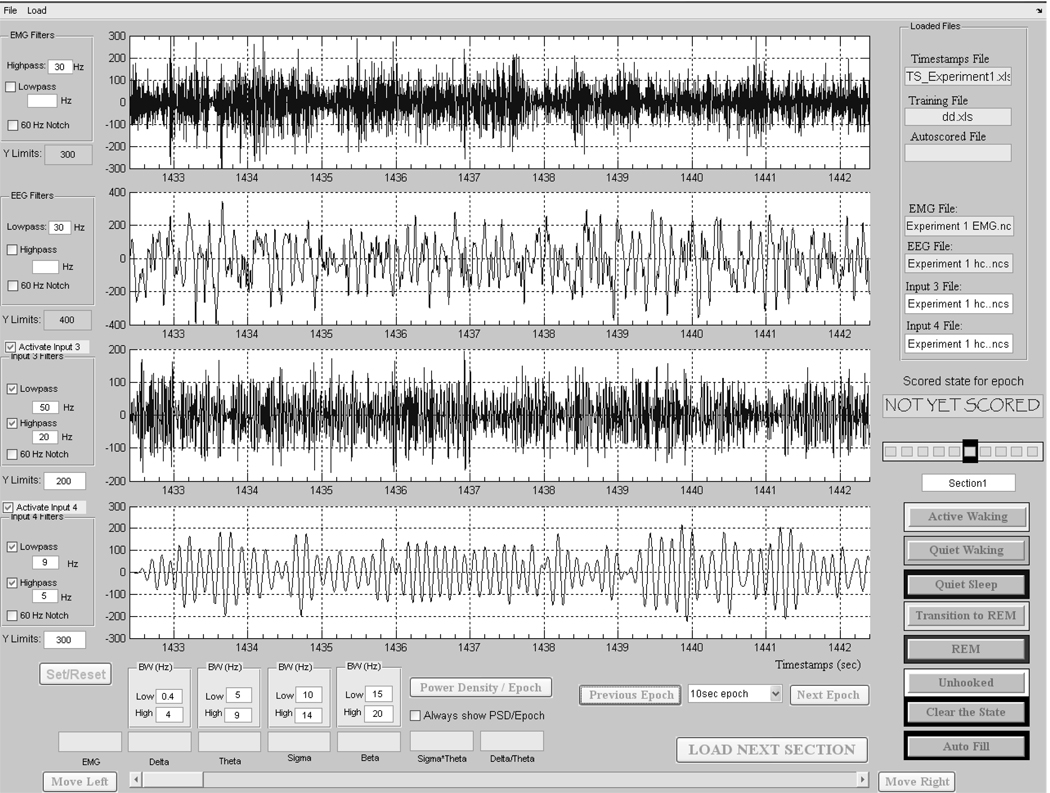
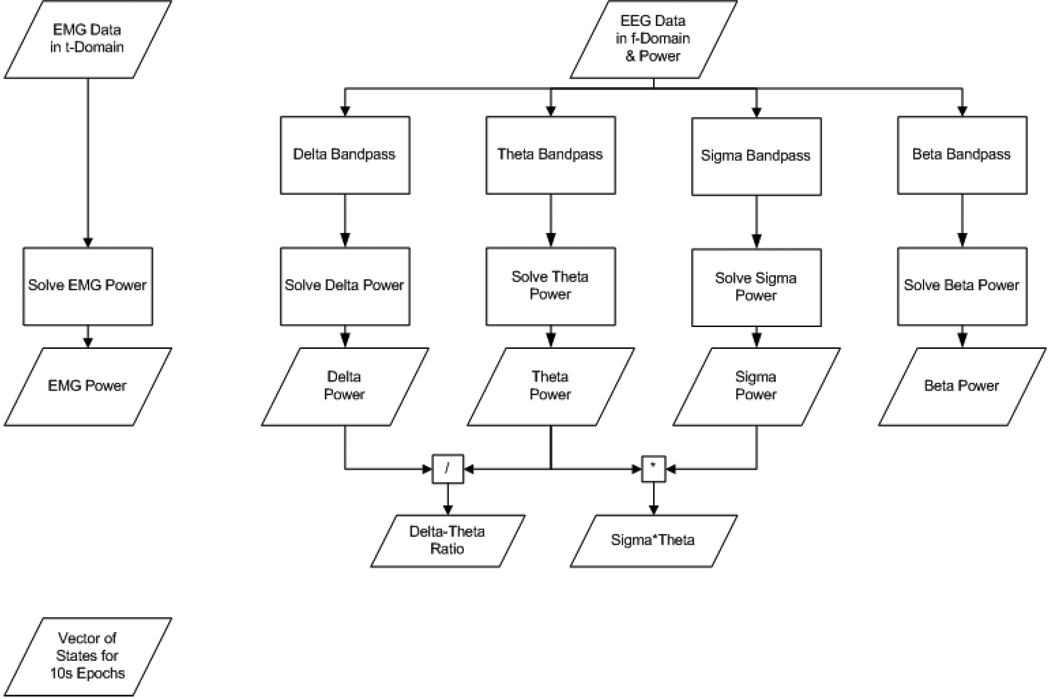
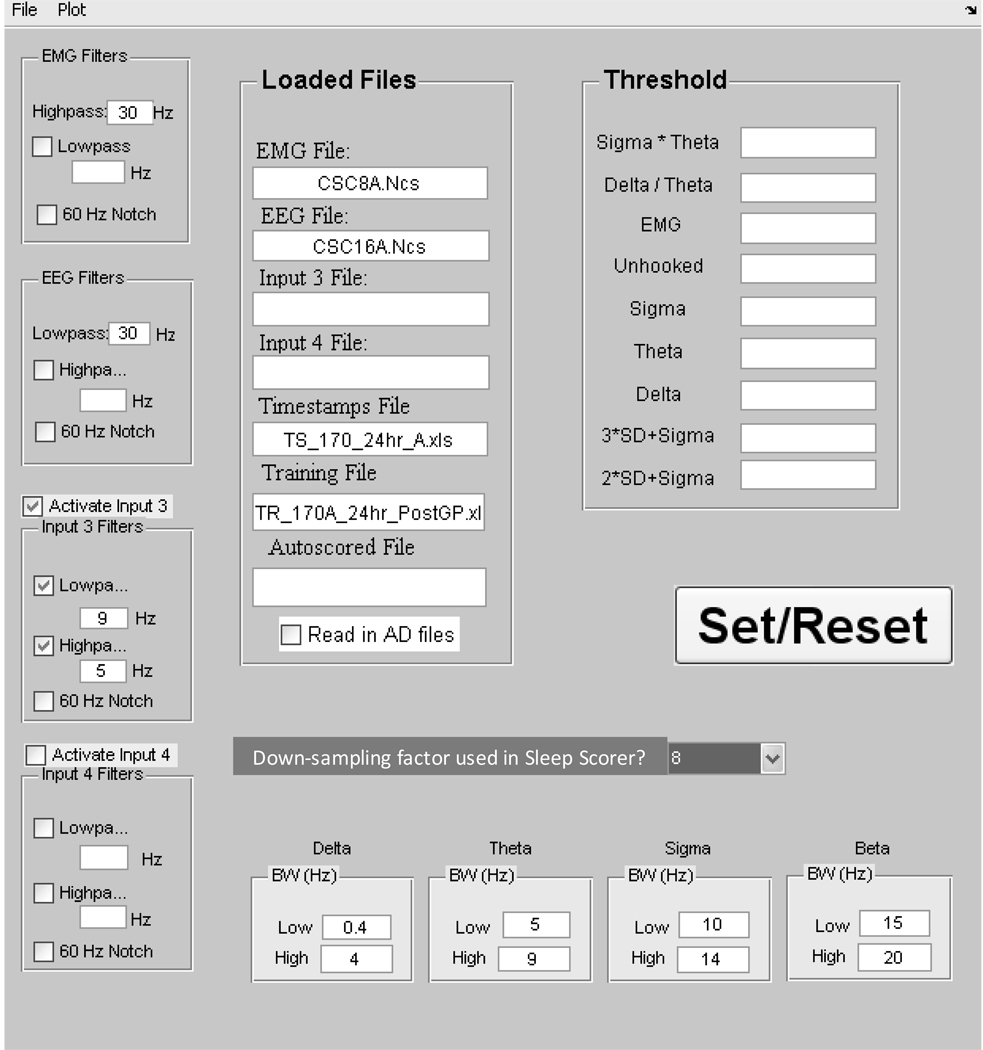
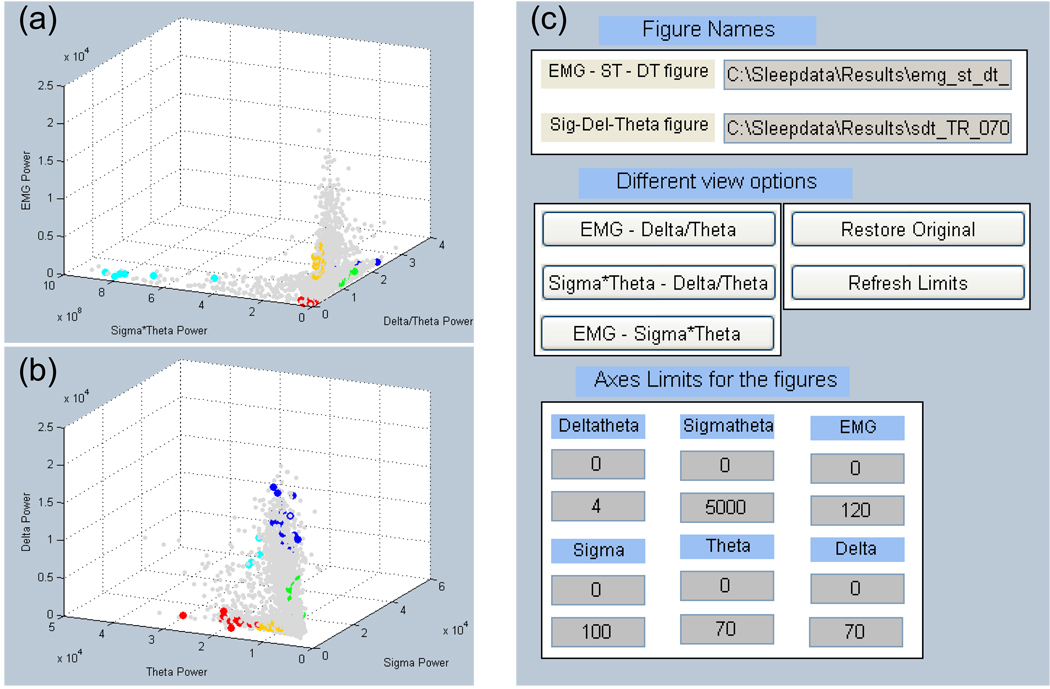
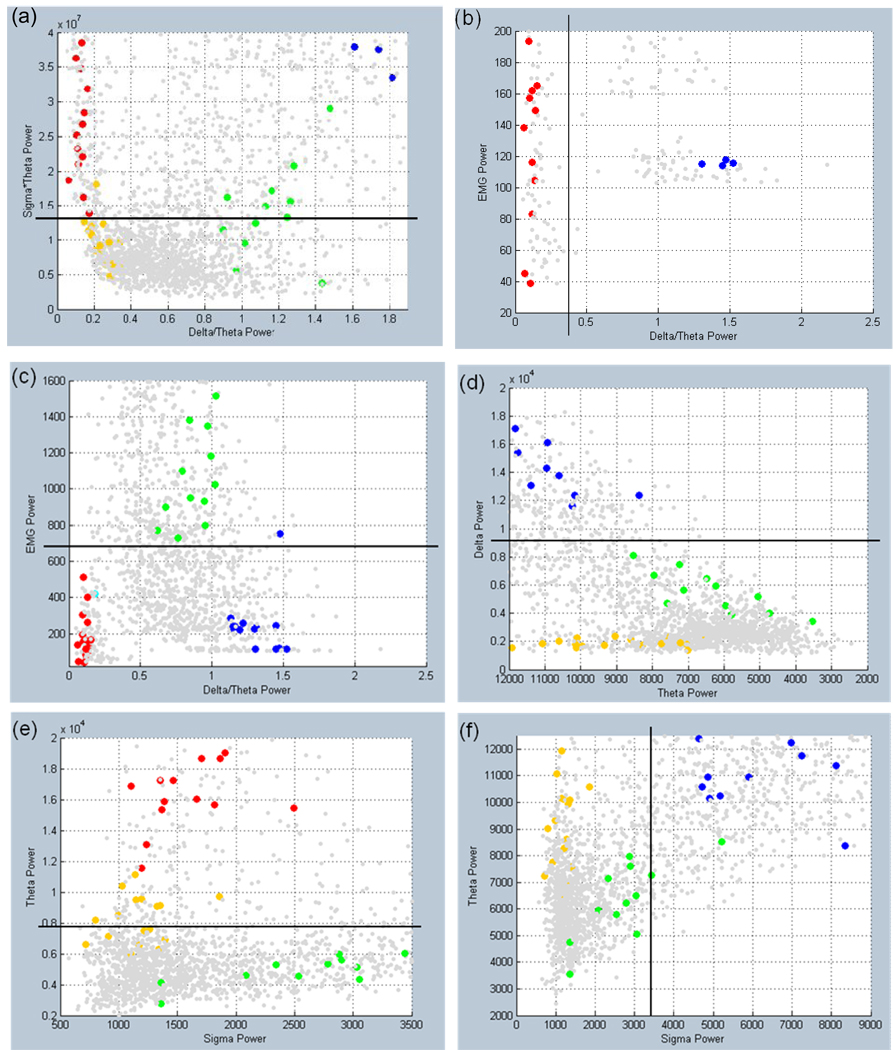
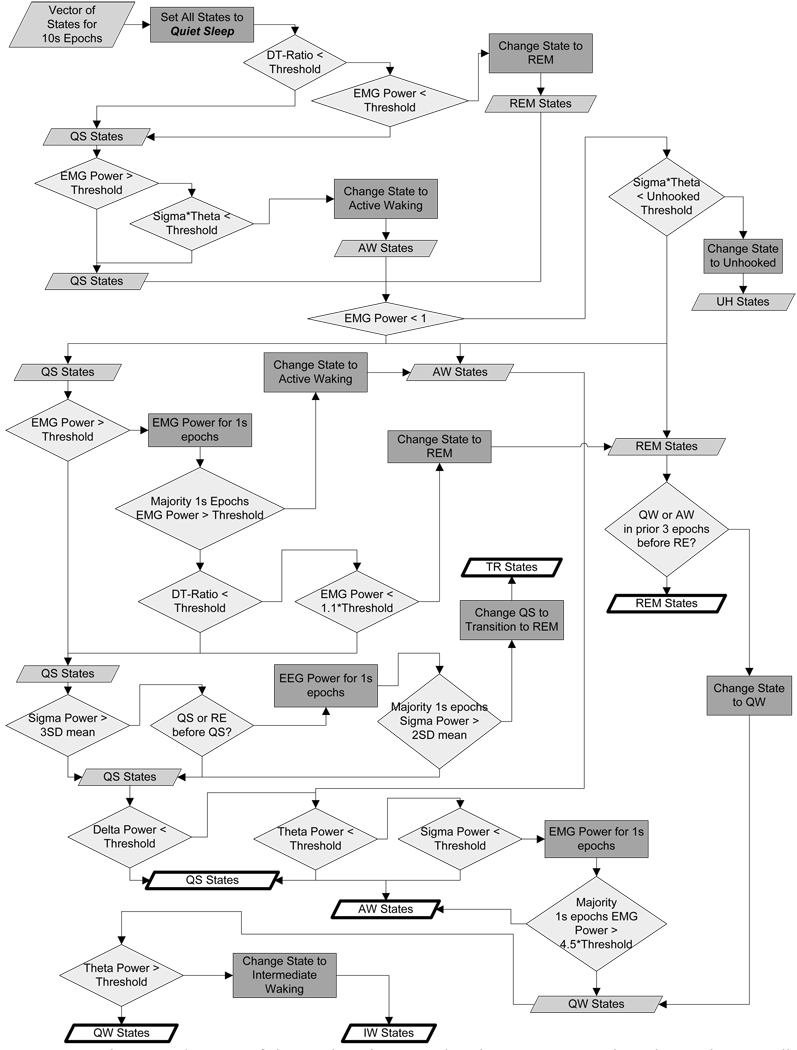
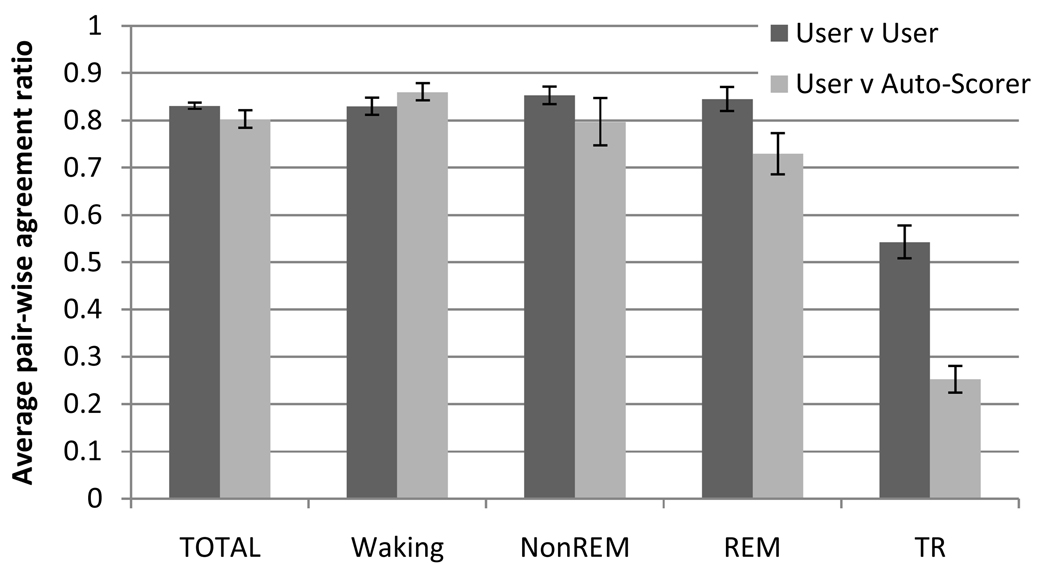
Manual state scoring of physiological recordings in sleep studies is time-consuming, resulting in a data backlog, research delays and increased personnel costs. We developed MATLAB-based software to automate scoring of sleep/waking states in rats, potentially extendable to other animals, from a variety of recording systems. The software contains two programs, Sleep Scorer and Auto-Scorer, for manual and automated scoring. Auto-Scorer is a logic-based program that displays power spectral densities of an electromyographic (EMG) signal and sigma, delta, and theta frequency bands of an electroencephalographic (EEG) signal, along with the delta/theta ratio and sigmaxtheta, for every epoch. The user defines thresholds from the training file state definitions which the Auto-Scorer uses with logic to discriminate the state of every epoch in the file. Auto-Scorer was evaluated by comparing its output to manually scored files from 6 rats under 2 experimental conditions by 3 users. Each user generated a training file, set thresholds, and auto-scored the 12 files into 4 states (waking, non-REM, transition-to-REM, and REM sleep) in 1/4 the time required to manually score the file. Overall performance comparisons between Auto-Scorer and manual scoring resulted in a mean agreement of 80.24+/-7.87%, comparable to the average agreement among 3 manual scorers (83.03+/-4.00%). There was no significant difference between user-user and user-Auto-Scorer agreement ratios. These results support the use of our open-source Auto-Scorer, coupled with user review, to rapidly and accurately score sleep/waking states from rat recordings.
Figures
References
-
- Benington JH, Kodali SK, Heller HC. Scoring Transitions to REM Sleep in Rats Based on the EEG Phenomena of Pre-REM Sleep: An Improved Analysis of Sleep Structure. SLEEP-NEW YORK- 1994;17:28. - PubMed
-
- Costa-Miserachs D, Portell-Cortés I, Torras-Garcia M, Morgado-Bernal I. Automated sleep staging in rat with a standard spreadsheet. Journal of Neuroscience Methods. 2003;130:93–101. - PubMed
-
- Crisler S, Morrissey MJ, Anch AM, Barnett DW. Sleep-stage scoring in the rat using a support vector machine. Journal of Neuroscience Methods. 2007 - PubMed
-
- Ferri R, Ferri P, Colognola RM, Petrella MA, Musumeci SA, Bergonzi P. Comparison between the results of an automatic and a visual scoring of sleep EEG recordings. Sleep. 1989;12:354–362. - PubMed
Publication types
MeSH terms
Grants and funding
LinkOut - more resources
Full Text Sources
Other Literature Sources
