. 2009 Jul 23;138(2):389-403.
doi: 10.1016/j.cell.2009.04.042. Epub 2009 Jul 16.

Defining the human deubiquitinating enzyme interaction landscape

Affiliations

Defining the human deubiquitinating enzyme interaction landscape

Mathew E Sowa et al. Cell. .

Abstract

Deubiquitinating enzymes (Dubs) function to remove covalently attached ubiquitin from proteins, thereby controlling substrate activity and/or abundance. For most Dubs, their functions, targets, and regulation are poorly understood. To systematically investigate Dub function, we initiated a global proteomic analysis of Dubs and their associated protein complexes. This was accomplished through the development of a software platform called CompPASS, which uses unbiased metrics to assign confidence measurements to interactions from parallel nonreciprocal proteomic data sets. We identified 774 candidate interacting proteins associated with 75 Dubs. Using Gene Ontology, interactome topology classification, subcellular localization, and functional studies, we link Dubs to diverse processes, including protein turnover, transcription, RNA processing, DNA damage, and endoplasmic reticulum-associated degradation. This work provides the first glimpse into the Dub interaction landscape, places previously unstudied Dubs within putative biological pathways, and identifies previously unknown interactions and protein complexes involved in this increasingly important arm of the ubiquitin-proteasome pathway.


Figures

Figure 1
Figure 1. CompPASS: A platform for semi-high throughput proteomic analysis of protein complexes and its application to Dubs
(A) Schematic illustration of the major steps in our parallel proteomics platform (see Supplemental Methods). (B) The total spectral counts for each bait protein (blue bars) is shown together with the corresponding number of HCIPs for the corresponding Dub (red bars) (DN-score ≥1). (C) Distribution of bait abundance across 75 Dubs analyzed. (D) Schematic representation of CompPASS showing components for storage, organization, and analysis of data from parallel proteomic datasets (top), linked with networking and functional analysis tools for identification of protein complexes and biological functions (bottom) (see Supplemental Methods). (E) Automated processing and metrics determination within the computational component of CompPASS. The Z-score is calculated using equations 1 and 2 while the DR-score is calculated as described in equation 3 where k is the total number of IP-MS/MS runs in the stats table. Determination of the DT score is depicted in the graph displaying the distribution of DR-scores from simulated data (see Supplemental Methods). Normalized D-score (DN) is calculated using equation 4.
Figure 2
Figure 2. D- and Z-scores as metrics for identification of high-confidence candidate interacting proteins from parallel proteomic data
(A, B) Plot of the DN-score vs. Z-score for proteins identified in the COPS6 IP-MS/MS dataset (multi-colored dots) overlaid with the Z- and DN-scores for the EGFP dataset (green dots) (A). Silver stained gel of the COPS6 immune-complex is shown on the left. HCIPs cluster in the upper right quadrant (grey box). Colors of individual proteins correspond to signalosome proteins and components of cullin-based E3s identified as COPS6 HCIPs (B) with known associated proteins marked with an asterisk. (C–E) Percent overlap of interacting proteins compared between four USP11 IP-MS/MS datasets (blue bars) and all biological replicates across 4 Dubs (red bars) or the merged USP11 analyses and EGFP (green bars) and all biological replicates (orange bars) for HCIPs (DN>1) (left) or the totality of interacting proteins (right) (C). Breakdown of the fraction of interacting proteins found in increasing numbers of USP11 biological replicates for all identified proteins (blue bars) and HCIPs (red bars) analyzed independently (D) or in combination (E) to display the percent of proteins in each category that were selected as HCIPs. The numbers above the bars in panel D represent the average TSC for interactors within that category. (F–H) Interaction networks for HCIPs found in COPS5 and COPS6 (F), USP22 (G), and Dubs associated with the proteasome regulatory particle (USP14, UCHL5, PSMD14, and PSMD7) (H) were created using networking tools in CompPASS. Maps were generated using Cytoscape with attribute files that reflect bait abundance (size of bait (blue squares)), DN-score (thickness of line), and Z-score (color of line). PPI database interactions are black dashed lines.
Figure 3
Figure 3. Interaction landscape of 75 human Dubs and their classification into topological categories
(A) Heat map generated from hierarchical clustering of the 774 HCIPs for 75 Dubs. The color of the interacting protein corresponds to its DN-score. (B) Interactions among HCIPs for each Dub were determined using CompPASS in conjunction with the STRING, BioGRID, and MINT PPI databases. The 7 topological groups based on the number of HCIPs and number of interactions among HCIPs are shown. Enlarged maps are provided in Figure S9.
Figure 4
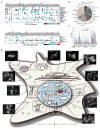
Figure 4. Placement of Dubs within a putative biological context
(A) Heat map of GO process (top) or component (bottom) terms (Table S8) associated with HCIPs for each Dub. The color of boxes corresponds to the number of HCIPs from that Dub assigned to a GO-derived category, normalized across all Dubs. (B and C) Distribution of 774 HCIPs into GO-derived categories (B) and percentages of Dubs (C) for each GO-derived category based on a minimum of either ≥2 (blue bars) or ≥3 (red bars) HCIPs assigned to that category. (D) Dubs with 3 or more HCIPs assigned to the same GO category were ascribed that cellular function (orange dots). A limited number of Dubs were localized within the cell based the localization of GFP-Dub fusion proteins that were stably expressed in either Hela or 293T cells (green dots) (Supplemental Methods). Dubs with both GFP localization data and GO assignments were placed accordingly (purple dots). Scale bar = 10 μm.
Figure 5
Figure 5. Experimental validation of selected Dub-HCIP pairs
Selected Dub-HCIP pairs were validated using one of four methods. 1) In the reciprocal tagging MS approach, 293T cells with stable expression of a Flag-HA-tagged HCIP (left most column in each set) were created and subsequent LC-MS/MS analysis of HA-immune-complexes was used to determine if the originally identified Dub (second column in each set) was present. A positive result indicates that indicated HCIP immune complex contained at least 1 peptide from the Dub of interest. Numbers in parenthesis indicate the number of Dub TSCs within the HCIP immune-complex and the corresponding DN-score. 2) N-Myc-tagged candidate interactors were transiently transfected into the corresponding Flag-HA-Dub stable cell line. Lysates were immunoprecipitated using anti-myc resin and blotted for the Dub of interest using an HA antibody. 3) N-Myc-tagged Dubs were transfected into 293T cells. Lysates were immunoprecipitated using anti-myc resin and blotted for the interactor of interest using antibodies that recognize the endogenous protein. 4) 293T lysates were immunoprecipitated using antibodies against the endogenous Dub and immunoblotted with antibodies against the endogenous HCIP. See Figure S10 for primary western blot data.
Figure 6
Figure 6. Reciprocal proteomic analysis of HCIPs identifies new components of core cellular functions
(A–D) Cytoscape generated merged interaction maps of HCIPs found in ≥ 2 IP-MS/MS experiments among USP1, USP12, USP46, PHLPP, PHLLPL, WDR20, WDR48, and DMWD (A), USP39, USP15, USP4, PRPF4, and SART3 (B), BRCC36, BRE, UIMC1, and HSPC142 (C), or USP10, G3BP1, and G3BP2 (D) immune-complexes. The color of the lines represents the identity of the bait involved in the association while black dashed lines are PPI database interactions.
Figure 7
Figure 7. Functional Validation of USP13 within the ERAD pathway
(A, B) HCIPs with Pfam domains associated with the ubiquitin-proteasome pathway found in association with Dubs (A). The number of HCIPs with the indicated Pfam domains found associated with particular Dubs is shown by the rainbow scale. The number of Dubs with HCIPs containing the indicated Pfam domains (orange bars) as well as the number of HCIPs containing the indicated domains (blue bars) are shown in (B). (C) TSCs corresponding to VCP/p97 identified within immune-complexes of indicated Dubs. (D) Schematic representation of USP13 and select HCIPs known to associate with VCP and their annotated Pfam domains. (E) TCRαGFP cellular fluorescence levels after knockdown of indicated genes. Two siRNA oligos were used against each gene. Fluorescence levels are relative to control siRNA transfection (siCK). For western blots confirming knockdown see Figure S14 (F) Histograms of TCRαGFP fluorescence after knockdown of indicated genes. (G) Cell viability, as measured by cellular ATP levels, was measured 72 hours after siRNA transfection and 48 hours after addition of 0.3μg/mL tunicamycin to the growth media. All values are relative to the amount viability measured after control siRNA transfection (siCK), Error bars represent the SEM of triplicate measurements. *p-value<0.05, **p-value<0.01 as determined by Student’s t-test.

Comment in

References

    1. Bellare P, Small EC, Huang X, Wohlschlegel JA, Staley JP, Sontheimer EJ. A role for ubiquitin in the spliceosome assembly pathway. Nat Struct Mol Biol. 2008;15:444–451. - PMC - PubMed
    1. Bennett EJ, Bence NF, Jayakumar R, Kopito RR. Global impairment of the ubiquitin-proteasome system by nuclear or cytoplasmic protein aggregates precedes inclusion body formation. Mol Cell. 2005;17:351–365. - PubMed
    1. Braun P, Tasan M, Dreze M, Barrios-Rodiles M, Lemmens I, Yu H, Sahalie JM, Murray RR, Roncari L, de Smet AS, et al. An experimentally derived confidence score for binary protein-protein interactions. Nat Methods. 2009;6:91–97. - PMC - PubMed
    1. Cohn MA, Kee Y, Haas W, Gygi SP, D’Andrea AD. UAF1 is a subunit of multiple deubiquitinating enzyme complexes. J Biol Chem. 2008 in press. - PMC - PubMed
    1. Cohn MA, Kowal P, Yang K, Haas W, Huang TT, Gygi SP, D’Andrea AD. A UAF1-containing multisubunit protein complex regulates the Fanconi anemia pathway. Mol Cell. 2007;28:786–797. - PubMed

Publication types