. 2009 Nov 18;139(3-4):323-32.
doi: 10.1016/j.vetmic.2009.06.028. Epub 2009 Jun 21.

Description of outcomes of experimental infection with feline haemoplasmas: copy numbers, haematology, Coombs' testing and blood glucose concentrations

Affiliations

Description of outcomes of experimental infection with feline haemoplasmas: copy numbers, haematology, Coombs' testing and blood glucose concentrations

Séverine Tasker et al. Vet Microbiol. .

Abstract

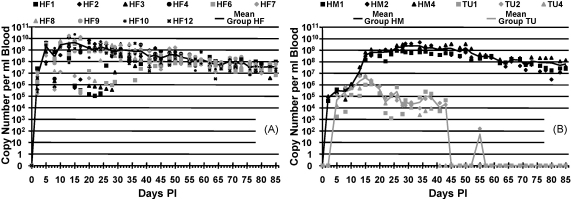
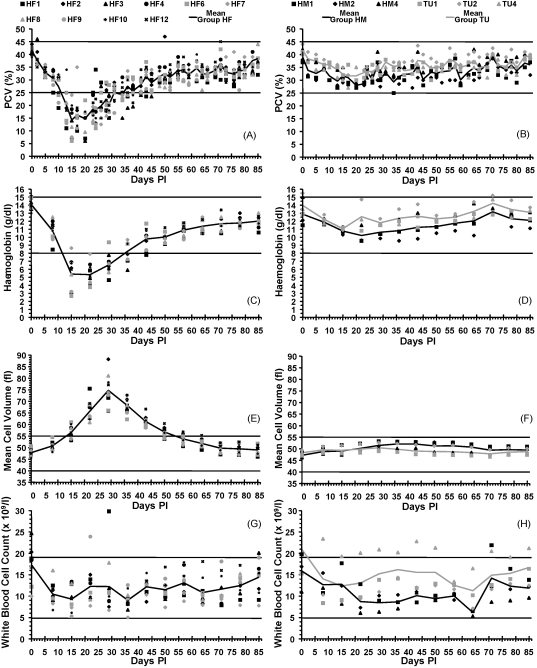
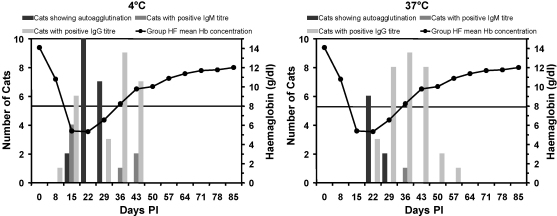
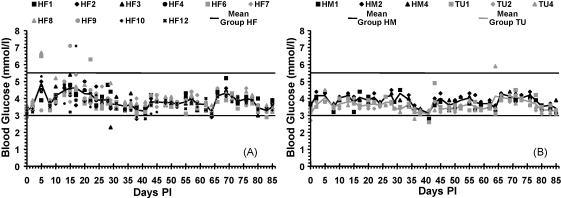
The aim of this study was to compare blood copy, haematological and glucose values between cats experimentally infected with either Mycoplasma haemofelis (Group HF: 10 cats), 'Candidatus M. haemominutum' (Group HM: 3 cats) or 'Candidatus M. turicensis' (Group TU: 3 cats). Blood samples were collected regularly up to 85 days post-infection (DPI) for haemoplasma real-time quantitative PCR, haematology, Coombs' testing and blood glucose measurement. Statistical analysis was performed using a general linear model (ANOVA) appropriate for a repeated measures experiment with significance set as P<0.05. Cats in Group TU had significantly lower blood copy numbers than cats in Group HF (P<0.001) and HM (P<0.001). All Group HF cats developed anaemia (often severe), macrocytosis and evidence of erythrocyte-bound antibodies whereas Groups HM and TU cats did not. Group HF had significantly lower PCVs, haemoglobin concentrations and red blood cell counts, and significantly higher mean cell volumes, than Groups HM and TU. In Group HF, erythrocyte-bound antibodies reactive at 4 degrees C (both IgM and IgG) appeared between 8 and 22 DPI and persisted for two to four weeks, whereas those reactive at 37 degrees C (primarily IgG) appeared between 22 and 29 DPI and persisted for one to five weeks. In most cats antibodies appeared after the fall in haemoglobin started. Although Group TU had significantly lower glucose concentrations than Groups HF (P=0.006) and HM (P=0.027), mean blood glucose concentrations remained within the reference range in all groups. This study demonstrates that M. haemofelis infection, in contrast to 'Candidatus M. haemominutum' and 'Candidatus M. turicensis' infection, can result in a severe macrocytic anaemia and the development of cold and warm reactive erythrocyte-bound antibodies.


Figures

Fig. 1
Fig. 1
Haemoplasma copy numbers recorded during the study against time DPI. Copy numbers shown per millliter of blood. (A) M. haemofelis copy number/ml of blood for each cat in Group HF plotted against time DPI, with mean of Group HF plotted as continuous line. (B) ‘Candidatus M. haemominutum’ and ‘Candidatus M. turicensis’ copy number/ml of blood for each cat in Groups HM and TU plotted against time DPI, with mean of Groups HM and TU plotted as continuous lines. Group TU had significantly lower copy numbers than both Groups HF (P < 0.001) and HM (P < 0.001).
Fig. 2
Fig. 2
Selected haematological variables during the study against time DPI; horizontal lines represent upper and lower reference range limits for each variable. (A) PCV values for each cat in Group HF plotted against time DPI, with mean of Group HF plotted as continuous line. Reference range: 25–45%. (B) PCV values for each cat in Groups HM and TU plotted against time DPI, with mean of Groups HM and TU plotted as continuous lines. Reference range: 25–45%. Group HF had significantly lower PCVs than both Groups HM (P = 0.018) and TU (P = 0.001). (C) Haemoglobin values for each cat in Group HF plotted against time DPI, with mean of Group HF plotted as continuous line. Reference range: 8–15 g/dl. (D) Haemoglobin values for each cat in Groups HM and TU plotted against time DPI, with mean of Groups HM and TU plotted as continuous lines. Reference range: 8–15 g/dl. Group HF had significantly lower haemoglobin values than both Groups HM (P = 0.005) and TU (P < 0.001). (E) Mean cell volumes for each cat in Group HF plotted against time DPI, with mean of Group HF plotted as continuous line. Reference range: 40–55 fl. (F) Mean cell volumes for each cat in Groups HM and TU plotted against time DPI, with mean of Groups HM and TU plotted as continuous lines. Reference range: 40–55 fl. Group HF had significantly higher MCVs than both Groups HM (P < 0.001) and TU (P < 0.001). (G) White blood cell counts for each cat in Group HF plotted against time DPI, with mean of Group HF plotted as continuous line. Reference range: 4.9–19 × 109/l. (H) White blood cell counts for each cat in Groups HM and TU plotted against time DPI, with mean of Groups HM and TU plotted as continuous lines. Reference range: 4.9–19 × 109/l. White blood cell counts were not significantly different between the groups (P = 0.306).
Fig. 3
Fig. 3
Graphs showing the collated autoagglutination and Coombs’ test data for all 10 Group HF cats, together with the Group HF mean haemoglobin values (reference range 8–15 g/dl) for temporal comparison to the time of onset of anaemia; horizontal lines represent upper and lower reference range limits. Note that if persistent autoagglutination was present, as shown by autoagglutination in the PBS control wells, the class of the antibody involved, at the temperature in which autoagglutination was demonstrated, could not be recorded. Hence cats with positive tests at either 4 °C or 37 °C will be graphically represented in either the autoagglutination bar chart or the IgG/IgM bar charts, but not both. (A) Number of cats in Group HF showing persistent autoagglutination, positive IgM titres or positive IgG titres at 4 °C alongside Group HF mean haemoglobin concentration. (B) Number of cats in Group HF showing persistent autoagglutination, positive IgM titres or positive IgG titres at 37 °C alongside Group HF mean haemoglobin concentration.
Fig. 4
Fig. 4
Blood glucose measurements during the study against time DPI; horizontal lines represent upper and lower reference range limits. Reference range: 3–5.5 mmol/l. (A) Blood glucose measurements for each cat in Group HF plotted against time DPI, with mean of Group HF plotted as continuous line. (B) Blood glucose measurements for each cat in Groups HM and TU plotted against time DPI, with mean of Groups HM and TU plotted as continuous lines. Group TU had significantly lower blood glucose concentrations than both Groups HF (P = 0.006) and HM (P = 0.027).

References

    1. Alleman A.R., Pate M.G., Harvey J.W., Gaskin J.M., Barbet A.F. Western immunoblot analysis of the antigens of Haemobartonella felis with sera from experimentally infected cats. J. Clin. Microbiol. 1999;37:1474–1479. - PMC - PubMed
    1. Bellamy J.E., MacWilliams P.S., Searcy G.P. Cold-agglutinin hemolytic anaemia and Haemobartonella canis infection in a dog. J. Am. Vet. Med. Assoc. 1978;173:397–401. - PubMed
    1. Berent L.M., Messick J.B., Cooper S.K. Detection of Haemobartonella felis in cats with experimentally induced acute and chronic infections, using a polymerase chain reaction assay. Am. J. Vet. Res. 1998;59:1215–1220. - PubMed
    1. Bundza A., Lumsden J.H., McSherry B.J., Valli V.E., Jazen E.A. Haemobartonellosis in a dog in association with Coombs’ positive anaemia. Can. Vet. J. 1976;17:267–270. - PMC - PubMed
    1. Burkhard M.J., Garry F. Artifactual hypoglycemia associated with hemotrophic mycoplasma infection in a lamb. Vet. Clin. Pathol. 2004;33:244–248. - PubMed

Publication types

MeSH terms