. 2009 Nov 13;33(8):1336-46.
doi: 10.1016/j.pnpbp.2009.07.010. Epub 2009 Jul 16.

Role of the bed nucleus of the stria terminalis in the control of ventral tegmental area dopamine neurons

Affiliations

Role of the bed nucleus of the stria terminalis in the control of ventral tegmental area dopamine neurons

Marion Jalabert et al. Prog Neuropsychopharmacol Biol Psychiatry. .

Abstract

Projections from neurons of the bed nucleus of the stria terminalis (BST) to the ventral tegmental area (VTA) are crucial to behaviors related to reward and motivation. Over the past few years, we have undertaken a series of studies to understand: 1) how excitatory inputs regulate in vivo excitable properties of BST neurons, and 2) how BST inputs in turn modulate neuronal activity of dopamine neurons in VTA. Using in vivo extracellular recording techniques in anesthetized rats and tract-tracing approaches, we have demonstrated that inputs from the infralimbic cortex and the ventral subiculum exert a strong excitatory influence on BST neurons projecting to the VTA. Thus, the BST is uniquely positioned to receive emotional and learning-associated informations and to integrate these into the reward/motivation circuitry. We will discuss how changes in the activity of BST neurons projecting to the VTA could participate in the development or exacerbation of psychiatric conditions such as drug addiction.


Figures
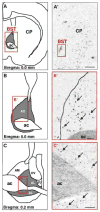
Figure 1
Figure 1
In situ hybridization analysis of VGLUT3 transcript distribution in the rat BST. A–C: Schematics illustrating the anterior region of the BST at two levels (A–B: AP= 0.0 mm from bregma; C: AP= −0.2 mm from bregma. A′– C′: Coronal brain sections were hybridized with antisense 35S-labeled oligonucleotides (A′) or DIC-UTP-labeled cRNA probes (B′ and C′). Neurons expressing VGLUT3 mRNA (arrows) are distributed in the anterior lateral group of the BST. ac, anterior commissure; AD, anterodorsal BST; AL, anterolateral BST; AM, anteromedial BST; OV, oval nucleus; JU, juxtacapsular nucleus. Scale bars: A′= 1.5 mm; B′ and C′= 0.2 mm. These illustrations are issued from experiments published in Gras et al., 2002 and Herzog et al., 2004.
Figure 2
Figure 2
ILCx and vSUB connect directly to BST neurons. A–C: Projections from ILCx to BST revealed by retrograde labeling in ILCx after injection of the subunit b of the cholera toxin (CTb) within the BST. A: Representative photomicrograph of a BST CTb injection (dark labeling). Inset: Diagram of the injection protocol used in this experiment B, C: Bright-field photomicrographs of retrograde labeling in ILCx after BST CTb injection. Injections of CTb into the BST revealed that cortical projections to the BST originate exclusively from the ILCx. In each of the four animals injected with CTb, we observed numerous retrogradely labeled neurons in the ILCx. No anterograde labeling was detected in the ILCx. In sections processed for CTb (dark labeling), cell bodies are observed in ILCx layers 2/3, 5 and 6. Cell bodies retrogradely labeled in the ILCx are shown at higher magnification in C and C′. Scale bar: A and B, 2.0 mm; C, 0.1 mm; C′, 10 μm. D–F: Projection from vSUB to BST revealed by retrograde labeling in vSUB after BST CTb injection. D: Diagram of the injection protocol used in this experiment. BST was injected with Alexa Fluor® 488 conjugated to CTb (Invitrogen; 60 nl). Five rats were sacrified 7 days after receiving CTb into the BST. Below, Anatomical localization on a cartography of the injection site and retrograde labeling represented in E and F. E: Representative photomicrograph of a BST CTb injection (bright labeling show the CTb fluorescence). F: Fluorescent photomicrographs of retrograde labeling in vSUB after BST CTb injection. In each of the five animals injected with CTb, we observed numerous retrogradely labeled neurons in the vSUB. Cell bodies retrogradely labeled in the vSUB are shown at higher magnification in F′. Scale bar: C and D, 0.1 mm; C′, 10 μm; E; F, 0.5 mm and F′, 20 μm. ac, anterior commissure; BST, bed nucleus of the stria terminalis; CTb, Cholera toxin-B subunit; ILCx, infralimbic cortex; PL, prelimbic cortex; Cg, cingular cortex; vSUB, ventral subiculum. Adapted from Massi and colleagues, 2008.
Figure 3
Figure 3
Results of input/ouput tests on BST neurons projecting to the VTA after stimulation of ILCx or the vSUB. A, Diagram of the stimulation protocol used in this experiment. ILCx was stimulated with a 100-pulse train. B, Increasing intensity of stimulation current in ILCx evoked higher response magnitude in VTA-projecting BST neurons. C, Typical post-stimulus time histograms (PSTHs) illustrate activity of VTA-projecting BST neurons in response to ILCx stimulation at increasing intensities (100, 200, 500 and 1000 μA). D, Diagram of the stimulation protocol used in this experiment. Here, the vSUB was stimulated with a 100-pulse train. E, Increasing intensities of vSUB stimulation evoked higher response magnitudes in VTA-projecting BST neurons. C, Typical PSTH illustrate activity of a VTA-projecting BST neuron in response to ILCx stimulation at increasing intensities (100, 200, 500 and 1000 μA). BST neurons projecting to the VTA are those antidromicaly driven by VTA stimulation. The slope of the relationship between injected current and evoked firing rate is similar in VTA-projecting BST neurons after stimulation of the ILCx or vSUB. BST, bed nucleus of the stria terminalis; ILCx, infralimbic cortex; vSUB, ventral subiculum; VTA, ventral tegmental area. Adapted from Massi and colleagues 2008.
Figure 4
Figure 4
Infusion of glutamatergic receptor antagonists within the BST blocks the excitatory drive from the ILCx or the vSUB on BST neurons that project to the VTA. A, Diagram of the stimulation protocol: ILCx or vSUB was stimulated with a 100-pulse train. A mixture of 100 μM amino-5-phosphonopentanoic acid (AP5) and 50 μM 6-cyano-7nitroquinoxaline-2,3-dione (CNQX) are microinfused through a pipette adjacent to the recording electrode. VTA-projecting BST neurons were identified after antidromic stimulation of the VTA. B and C: Graphs illustrating the effects of ionotropic glutamatergic (black bars) antagonists on excitation of BST neurons projecting to the VTA, after stimulation of the ILCx (B) or the vSUB (C). Scores are percentage ± SEM of baseline response magnitudes for VTA projecting BST neuronal responses evoked by ILCx or vSUB electrical stimulation during microinjection into the BST of aCSF (white bars), the mixture of 50 μM CNQX plus 100 μM AP5 (black bars). Numbers of neurons recorded in each group are mentioned in brackets above each histogram bar. A Student test for pairwise comparisons was performed for excitation.*** p<0.001. D, Effect of the CNQX+AP5 cocktail on a characteristic BST neuron projecting to the VTA during ILCx electrical stimulation. Typical peristimulus time histograms (PSTHs) show ILCx-evoked responses before, during and after (recovery) CNQX+AP5 injection into the BST for the same BST neuron identified as projecting to the VTA. Inset in D shows orthodromic spikes evoked by stimulation of ILCx. Microinjection of CNQX+AP5 prevented the short latency activation of BST neurons evoked by ILCx stimulation, and decreased basal activity but had no effect on the inhibition. E, Effect of the CNQX+AP5 cocktail on a characteristic BST neuron projecting to the VTA during vSUB electrical stimulation. Typical PSTH show vSUB evoked responses before, during and after (recovery) CNQX+AP5 injection into the BST, for the same BST neuron identified as projecting to the VTA. Inset in E shows orthodromic spikes evoked by stimulation of vSUB. Microinjection of CNQX+AP5 prevented the short latency activation of BST neurons evoked by ILCx or vSUB stimulation, and decreased the basal activity but had no effect on the inhibition. BST, bed nucleus of the stria terminalis; ILCx, infralimbic cortex; REC, recording electrode; vSUB, ventral subiculum; VTA, ventral tegmental area; ac, anterior commissure; STIM, stimulating electrode. Adapted from Massi and colleagues 2008.
Figure 5
Figure 5. Projection from the BST to the VTA revealed by antidromic stimulation from the VTA and retrograde labeling in the BST after injection of CTb into the VTA
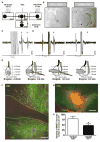
A, Diagram of the stimulation protocol used in this experiment. Here, the ILCx or vSUB are stimulated with a 100-pulse train, and BST neurons projecting to the VTA were identified by antidromic activation from the VTA. B, Left, Recording location for a BST neuron projecting to the VTA (dark spot, black arrow). Right, electrical stimulation site in the VTA (lesioned area, black arrow). Scale bars: 0.5 mm. C and D: Five superimposed traces illustrating high-frequency activation and collision test for a BST cell driven from the VTA. C, Driven spikes (black circles) elicited by each of paired stimuli (vertical lines, 2 ms interpulse interval), indicating frequency following for this cell at 500 Hz. D, Left, Stimulation of the VTA 12 ms after spontaneous spikes (left side of traces) elicit driven spikes (black circle) at 9.5 ms latency. Right, Driven spikes are occluded for similar stimuli delivered 10 ms after spontaneous impulses indicating collision between spontaneous and driven spikes. The asterisk indicates when driven spikes would have occurred in the absence of collision. E, Schematic presentation of neuronal recording sites in the BST of neurons projecting to the VTA. Black circles: locations of synaptically driven BST neurons by single-pulse ILCx electrical stimulation. White circles: locations of synaptically driven BST neurons by single-pulse vSUB electrical stimulation. Numbers refer to stereotaxic coordinates. Note that all the BST neurons projecting to the VTA tested were driven by ILCx or vSUB stimulations. F–H, Projection from the BST to the VTA revealed by retrograde labeling in the BST after injection of CTb into the VTA. F, Epifluorescence photomicrographs illustrating retrograde labeling in the dorsal and ventral parts of the BST after CTb injection into the VTA. G, Photomicrograph illustrating a representative CTb injection site in the VTA. The sections have been processed dually for CTb (red) and tyrosine hydroxylase (TH; green). Scale bars: F, 100 μm; G, 200 μm. H, Bar histograms comparing the density of CTb-immunoreactive neurons in the dorsal and ventral BST after an injection of CTb in the VTA (n=15 rats perfused 7 days after receiving CTb into the VTA). t-test was used to establish statistical differences between the dorsal and the ventral part of the BST. BST, bed nucleus of the stria terminalis; ILCx, infralimbic cortex; REC, recording electrode; vSUB, ventral subiculum; VTA, ventral tegmental area; ac, anterior commissure; STIM, stimulating electrode. Adapted from Massi and colleagues 2008.
Figure 6
Figure 6
Effects of AP5+CNQX on VTA DA neuronal responses evoked by BST electrical stimulation A, Diagram of the stimulation protocol used in this experiment. Here, the BST stimulated with a 100-pulse train. DA neurons were recorded within the VTA and the CNQX+AP5 cocktail was microinfused through a pipette adjacent to the recording electrode. B, Mean (±SEM) response magnitudes (Rmags) of VTA DA neuronal responses evoked by BST stimulation before (black bars) and during (white bars) microinjection of AP5 (100 μM) + CNQX (50 μM) into the VTA. Microinjection of AP5+CNQX prevented the short latency activation of DA VTA neurons evoked by BST stimulation. The same cells were used before and after drug application. A Student t-test for pairwise comparisons was performed. *p<0.05. C, PSTHs showing VTA evoked responses before and during drug injection into the VTA for a typical DA neurons. Single pulse stimuli (0.5 ms, 0.5/sec) were delivered at time zero. D, Diagram of the stimulation protocol used in this experiment. Here, the BST stimulated with local infusion of glutamate (Glu, 50mM, 60nl). DA neurons were recorded within the VTA and the CNQX+AP5 cocktail was microinfused through a pipette adjacent to the recording electrode. E, Oscilloscope traces of a VTA DA neuron showing the typical firing activity before and after infusion of Glu at 50 mM into the BST. Glu injection is designated by the line above each trace. F and G, Effects of AP5 + CNQX on VTA DA neuronal responses evoked by BST stimulation by Glu microinjection : Graphs comparing firing rate (F) and bursts (G) of VTA DA neurons before (white bars) and during local microinfusion of 50 mM CNQX + 100 mM AP5 into the VTA. Note that the CNQX/AP5 mixture blocked both the increase in bursting as well as the increased in firing rate of VTA DA neurons evoked by chemical stimulation of the BST. BST, bed nucleus of the stria terminalis; Glu, glutamate; REC, recording electrode; VTA, ventral tegmental area; STIM, stimulating electrode. Data were analyzed by two-way ANOVA. * p<0.005. Adapted from Georges and Aston-Jones, 2001, .
Figure 7
Figure 7
We propose a model to describe the neural circuitries by which the ILCx and vSUB modulate the BST neurons projecting to the VTA. Electrical stimulation of the ILCx and vSUB activate excitatory afferents to the BST wich in turn activates BST neurons projecting to the VTA. As a result, we recently demonstrated that activation of the ILCx produces phasic activation of midbrain DA neurons. In this model we propose that the ILCx-BST and vSUB-BST projections provide sufficient excitatory influence to activate the sub-population of BST neurons projecting to the VTA. BST, bed nucleus of the stria terminalis; ILCx, infralimbic cortex; VTA, ventral tegmental area; DA, dopaminergic neurons.

Similar articles

Cited by

References

    1. Aston-Jones G, Harris GC. Brain substrates for increased drug seeking during protracted withdrawal. Neuropharmacology. 2004;47:167–179. - PubMed
    1. Aston-Jones G, Delfs JM, Druhan J, Zhu Y. The bed nucleus of the stria terminalis. A target site for noradrenergic actions in opiate withdrawal. Ann N Y Acad Sci. 1999;877:486–498. - PubMed
    1. Blaha CD, Yang CR, Floresco SB, Barr AM, Phillips AG. Stimulation of the ventral subiculum of the hippocampus evokes glutamate receptor-mediated changes in dopamine efflux in the rat nucleus accumbens. Eur J Neurosci. 1997;9:902–911. - PubMed
    1. Bowers WJ, Attiast E, Amit Z. Stress enhances the response to reward reduction but not food-motivated responding. Physiol Behav. 1999;67:777–782. - PubMed
    1. Burow A, Day HE, Campeau S. A detailed characterization of loud noise stress: Intensity analysis of hypothalamo-pituitary-adrenocortical axis and brain activation. Brain Res. 2005;1062:63–73. Epub 2005 Oct 2025. - PMC - PubMed

Publication types

MeSH terms