Comparative Study
. 2009 Oct;9(7):475-89.
doi: 10.1016/j.gep.2009.07.007. Epub 2009 Jul 16.

Comparative analysis of conditional reporter alleles in the developing embryo and embryonic nervous system

Affiliations
Comparative Study

Comparative analysis of conditional reporter alleles in the developing embryo and embryonic nervous system

Debra Ellisor et al. Gene Expr Patterns. 2009 Oct.

Abstract

A long-standing problem in development is understanding how progenitor cells transiently expressing genes contribute to complex anatomical and functional structures. In the developing nervous system an additional level of complexity arises when considering how cells of distinct lineages relate to newly established neural circuits. To address these problems, we used both cumulative marking with Cre/loxP and Genetic Inducible Fate Mapping (GIFM), which permanently and heritably marks small populations of progenitors and their descendants with fine temporal control using CreER/loxP. A key component used in both approaches is a conditional phenotyping allele that has the potential to be expressed in all cell types, but is quiescent because of a loxP flanked Stop sequence, which precedes a reporter allele. Upon recombination, the resulting phenotyping allele is 'turned on' and then constitutively expressed. Thus, the reporter functions as a high fidelity genetic lineage tracer in vivo. Currently there is an array of reporter alleles that can be used in marking strategies, but their recombination efficiency and applicability to a wide array of tissues has not been thoroughly described. To assess the recombination/marking potential of the reporters, we utilized CreER(T) under the control of a Wnt1 transgene (Wnt1-CreER(T)) as well as a cumulative, non-inducible En1(Cre) knock-in line in combination with three different reporters: R26R (LacZ reporter), Z/EG (EGFP reporter), and Tau-Lox-STOP-Lox-mGFP-IRES-NLS-LacZ (membrane-targeted GFP/nuclear LacZ reporter). We marked the Wnt1 lineage using each of the three reporters at embryonic day (E) 8.5 followed by analysis at E10.0, E12.5, and in the adult. We also compared cumulative marking of cells with a history of En1 expression at the same stages. We evaluated the reporters by whole-mount and section analysis and ascertained the strengths and weaknesses of each of the reporters. Comparative analysis with the reporters elucidated complexities of how the Wnt1 and En1 lineages contribute to developing embryos and to axonal projection patterns of neurons derived from these lineages.


Figures

Fig. 1
Fig. 1
En1 and Wnt1 gene expression domains and genetic marking approaches. En1 is expressed in the mes/r1 at E8.5 (A). By E9.5 the mes/r1 domain expands with En1 localized to the entire mes (B). At E10.5 En1 is restricted to the posterior mes and in r1 as well as in somites (som) and forelimb (fl) (C). En1 at E12.5 is localized to the inferior colliculus of the dorsal midbrain (d. Mb), the cerebellum (Cb), and spans the ventral Mb (v. Mb) and ventral anterior hindbrain (v. Hb); note the lack of expression in craniofacial (cf) regions (D). Wnt1 is expressed in the mes at the open neural tube stage (E8.5) and in more posterior rhombomeres (rh); note the lack of expression in r1 (E). After neural tube closure, Wnt1 becomes restricted to the midline of the dorsal and ventral mes and to a ring at the posterior mes; Wnt1 is also expressed in posterior rh and in the spinal cord (SC) (F, G). By E12.5, Wnt1 is detected in the inferior colliculus of the d. Mb (H) and faintly in the caudal part of the embryo. These expression patterns reveal the domains that will be marked cumulatively by En1Cre or temporally by tamoxifen administration at E8.5 by Wnt1-CreERT. The Z/EG (I) and mGFP (J) phenotyping alleles are shown in schematic form. Prior to recombination cells expressing the Z/EG allele can be detected by β-galactosidase (β-gal) activity or expression (blue), but cells that have undergone recombination can be detected by EGFP fluorescence or GFP immunolabeling (I, green). In contrast, unrecombined cells in mGFP mice are not marked (J), but after recombination, “marked” cells are detected by either GFP (green) or nuclear β-gal (red) immunocytochemistry (J). Schematic illustrations of cumulative marking (K-1) and GIFM (K-2, K-3) strategies. Illustrations of the En1 and Wnt1 gene expression domains in the mes/r1 during early embryogenesis are shown as examples below the time line. The stages where marking occurs are indicated above the time line and the ensuing, marked domains are assessed as described in the text.
Fig. 2
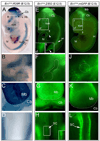
Fig. 2
Cumulative marking of cells with a history of expressing En1 in E12.5 embryos. At E12.5, cumulatively marked En1-expressing cells in En1Cre;R26R embryos were detected by whole-mount x-gal labeling (for 4 hours) (A–D). Cells with a history of En1 expression populated the entire Mb, Cb and ventral-anterior Hb (v.Hb) (A, C). Craniofacial (cf) structures surrounding the eyes were also clearly visible (A, B). The intercostal domain (ic), the lateral body wall (lbw), and putative ventral SC were prominently marked (A, D); marking of the limbs (fl and hl) was not visible because of the angle and faint labeling. Marked cells in En1Cre;Z/EG embryos could be detected by endogenous fluorescence on a fluorescent dissecting scope (E–H) and the marked pattern was similar to En1Cre;R26R mice. Also, the ventral domains of the forelimb (fl) and hindlimb (hl) were labeled (E, arrowhead; inset). Marked cells were prominent in the craniofacial region (cf) and could be seen in the vicinity of the vibrissae (E, inset). In addition, two thick cohorts of GFP+ cells were located posteriorly on the dorsal and ventral side of the eye juxtaposed between the eye and the ventral Mb/Hb (F). The entire Mb (E, G) and the full extent of the Cb (G) as well as the lateral body wall (E) were labeled. There was also a faint bundle of labeled axons in the putative ventral SC (H, arrows, inset). Notably, we could not readily detect the SC in sagittal views nor could we detect intercostal domains that were observable by whole-mount in En1Cre;R26R mice. The cf and sc insets in E and H are from regions indicated by marquees that were subject to increased brightness and contrast adjustments to more clearly show the structures. The fl inset is from a coronal view of the same embryo to better view limb labeling. En1Cre;mGFP embryos (I–L) were densely labeled in the ventral Mb (v. Mb) while fine radially oriented projections were seen in the dorsal Mb (I, K). Labeling was not visible in the Cb, likely due to a small number of differentiating neurons revealed with the mGFP reporter. Within the craniofacial (cf) domain, there was invariant labeling around the eye and also dispersed as distinct puncta in close proximity to the vibrissae (J). A distinct bilateral set of marked cells/projections was located in the dorsal SC (L, arrow). Non-neural domains including the limbs (fl and hl), intercostal domains and lateral body wall were unmarked.
Fig. 3
Fig. 3
Cellular analysis of cumulative marking in E12.5 En1Cre;R26R embryos. Sagittal sections were immunolabeled with an anti-β-gal antibody to detect Cre-mediated recombination in En1 derived cells (red) and counter stained with the nuclear marker Hoechst 33342 (blue) (A–E). The entire Mb, Cb, and ventral Hb were marked (A–D). Marked cells in the ventral Mb contributed to maturing tyrosine hydroxylase (TH)+ dopamine neurons (C). A sharp line of demarcation delineated the anterior limit of the Mb (A, arrow) and the posterior limit of the ventral-anterior Hb (A, D, arrowheads). The asterisk (B*) in A indicates that the section shown at high magnification in B was from an adjacent section with higher tissue quality. Laterally, trigeminal ganglia were comprised of marked cells (E). Cells in the lateral anterior Hb were marked and a bundle of labeled projections coursed toward the trigeminal ganglia at the Hb flexure (E). En1Cre marked cells also densely populated the rostral craniofacial (cf) region (E). A whole mount view of the embryo is shown (F).
Fig. 4
Fig. 4
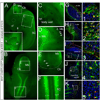
Cellular analysis of cumulative marking in E12.5 En1Cre;Z/EG embryos. Sagittal sections were double immunolabeled with antibodies recognizing β-gal (un-recombined cells, red) and GFP (recombined “marked” cells, green) and counter stained with the nuclear marker Hoechst 33342 (blue) (A–F). The dorsal Mb both medially (A, B) and laterally (E) was marked nearly in its entirety. There were unlabeled cells primarily in the most rostral-medial Mb (A) and in the more dorsal-lateral (Mb) (E). The posterior Mb and the Cb were densely populated with cells marked with En1Cre (B). The ventral Mb was composed of a densely marked cells as well as axonal projections, but the extent of their marking prohibited a clear demarcation between cell bodies and axons (C). A sharp boundary of marked cells was seen at the posterior limit of the ventral Hb (D, arrowheads), consistent with the R26R reporter. We also observed axonal projections emanating posteriorly from the v. Hb (D, bracket), which then traversed the ventral half of the brainstem. GFP+ cells filled the lateral anterior Hb (E, arrows) with a tight bundle of axons that coursed ventrally along the ventral surface (E). Notably, this bundle was much tighter and ran along a narrower trajectory versus the bundles that arose from the medial anterior Hb (compare D to E). At the point of the putative pontine flexure, a group of axons bifurcated from the main bundle and formed a contiguous network with the trigeminal ganglia and more rostral craniofacial tissue (E, F; arrowheads). To more fully discern the marked populations, we also assayed transverse sections (obtained from planes shown in G): Cells with a history of expressing En1 were radially organized and completely spanned the neuroepithelial tissue in the dorsal Mb (G-1) and the ventral Mb (G-2). In the SC, a bilateral cluster of GFP+ cells was located in the ventral-lateral cord (G-3, arrow) and clearly sent axons toward the cord periphery (6-3, brackets) where they formed a fascicle that exited the cord. Marked cells were also seen lateral to the SC in the body wall and intercostal domains (G-3). The inset in G-3 shows a low magnification view of the entire SC while G-3 shows half of the SC and a portion of the lateral body wall.
Fig. 5
Fig. 5
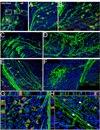
Cellular analysis of cumulatively marked neurons and developing neural circuits in E12.5 En1Cre;mGFP embryos. Upon Cre mediated recombination, marked cells are detectable by nuclear β-gal labeling (red) and robust GFP labeling (green) of neuronal processes and faintly labeled soma. At low magnification the dorsal-medial and dorsal-lateral Mb and Cb of En1Cre;mGFP embryos appeared to be devoid of labeling (A). However, at high magnification marked cells were observed distal to the ventricular zone consistent with differentiating neurons (B, inset). The nuclei of marked cells formed a single DZ at the periphery of the dorsal Mb and in the Cb (B, arrowhead). In addition, fine projections radiated toward, and coursed along the surface of the Mb. In the Cb, axons emanated away from the DZ (B, arrowhead). The ventral Mb has β-gal+ nuclei and GFP+ processes that delineated differentiating neurons that had projections confined to DZ (C). En1-derived neurons of ventral-anterior Hb were organized into discrete clusters of differentiated neurons confined to the Hb by a posterior boundary (D, arrowheads). The Hb neurons had projections that emanated posteriorly and contributed to a conduit of axons that occupied the ventral half of the brainstem (D, bracket). Marked neurons (β-gal+) were distributed along the upper and anterior portion of the lateral Hb, but their projections emanated caudally (E, arrows). Projections bifurcated at the pontine flexure (I, white arrowheads) and formed a network with marked trigeminal ganglia neurons - axon bundles intermittently but stereotypically innervated the vibrissae of the anterior craniofacial domain (E, F). Other projections from the Hb coursed caudally (F, yellow arrowhead, arrow). In transverse sections obtained along the anterior-posterior axis (G), we observed differentiating neurons with projections that coalesced at the midline in a peripheral zone in the dorsal Mb (G-1). Neurons (β-gal+, red) were organized into discrete clusters in the ventral Mb (G-2). In the Mb, axons projected radially away from the marked neurons (G-2, white arrowheads) and joined a fascicle of axons crossing the midline (G-2, bracket). In the SC, cells with a history of expressing En1 (β-gal+, red) were localized to the ventral-lateral cord (G-3, arrow) and their axons joined to form a fascicle at the periphery of the cord (G-3, bracket); note the lack of marked cells in the lateral body wall or intercostal domains that were marked with the Z/EG allele (compare 5G-3 to 4G-3).
Fig. 6
Fig. 6
The mGFP reporter is expressed in differentiated neurons while R26R and Z/EG are expressed in both differentiated neurons and proliferating progenitors. The Mb, Cb, craniofacial region, and trigeminal ganglia were evaluated in E12.5 En1Cre;mGFP mouse embryos for the presence of phosphorylated histone H3 (pHH3), which is a marker for mitotic cells (A–D). Cells with a history of expressing En1 as detected by the mGFP allele (nβ-gal+, red) were positioned in a DZ opposite to the VZ containing mitotic cells (green) of the dorsal Mb (A) and Cb (B). Faintly labeled pHH3+ cells (punctate green) were observed between these two zones (H, arrowheads). Mitotic cells (green) were distributed throughout the craniofacial region, which was devoid of En1-derived differentiated neurons (C). In contrast, the trigeminal ganglia were devoid of pHH3 labeling but had an abundance of differentiating neurons that had been derived from En1 expressing cells (D). We analyzed En1-derived cells in the trigeminal ganglia from E12.5 embryos using the three different reporter alleles and compared marked cells to pHH3 (E–G). En1Cre;mGFP trigeminal contained marked cells (nβ-gal+, red) (E). En1Cre;R26R trigeminal also contained marked cells (β-gal+, red) (F). En1Cre;Z/EG trigeminal had En1-derived cells (GFP+, green). We did not detect pHH3 in the trigeminal ganglia with any of our marking schemes (E–G). We then compared marked cells and pHH3 in the dorsal Mb of En1Cre mice and Wnt1-CreERT mice with the different reporter alleles (H–L). Cumulative marking with En1Cre;mGFP showed that the En1-derived cells (red) were located in a zone opposite from pHH3+ mitotic cells in the VZ (green); the marked cells were never pHH3+ (H). In contrast, En1-derived cells detected with the Z/EG reporter (GFP+, green) were distributed throughout the dorsal Mb including the superficial DZ and overlapped with pHH3+ cells (red) in the VZ (I, arrows). En1Cre;R26R Mb also had marked cells (β-gal+, red) in the DZ and the pHH3+ VZ (green) (J, arrows). GIFM with either Wnt1-CreERT;mGFP (K) or Wnt1-CreERT;R26R (L) revealed that the mGFP reporter labeled cells in the DZ (K, nβ-gal+, red), but not in mitotic cells (green) while the R26R reporter labeled cells (L, β-gal+, red) throughout the Mb including the DZ and the VZ (L, arrows). Thus, the mGFP reporter detects differentiated neurons while the Z/EG and R26R reporters label differentiated cells and mitotic progenitors. Arrow heads delineate pHH3+ cells located in between the VZ and DZ.
Fig. 7
Fig. 7
GIFM of the Wnt1 lineage in Wnt1-CreERT;R26R embryos. Tamoxifen was administered to pregnant females at E8.5 and embryos were assessed at E12.5 by whole-mount x-gal labeling (A) or by β-gal immunolabeling of sagittal sections (B–D). Fate mapped cells were observed in the Mb, choroid plexus (cp), and SC, but not in the Cb or body walls (A). In R26R littermates without the Wnt1-CreERT transgene, no x-gal labeling was detected (A, inset). In off-midline sections (B), β-gal+ cells (red) were distributed as radially oriented “clonal-like” cohorts in the medial Mb (B-1). Wnt1-derived cells were not detected in the Cb (B). Marked cells of the trigeminal ganglia (C) were not organized into columns but were loosely distributed in the neuroepithelium (C-2). Wnt1-derived neurons in the SC were present in DRG (D, D-3).
Fig. 8
Fig. 8. GIFM of the Wnt1 lineage with the Z/EG reporter allele
Tamoxifen administration at E8.5 did not yield appreciable labeling when analyzed by whole-mount fluorescence (A); a bright field image of the unlabeled embryo (A, inset). However, GFP immunolabeling on sections revealed a sparse population of marked cells (B,C). The location of the marked cells was consistent with Wnt1-CreERT;R26R and Wnt1-CreERT;mGFP embryos. In the lateral dorsal Mb (B) small cohorts of cells were marked and displayed fine axonal projections (B-1, B-2, arrows). In the posterior Hb (post Hb), which is caudal to the Cb, the labeled neurons had projections that were localized to a cell-sparse zone (C) and displayed an elaborate morphology (C-3). The DRG (D) contained immature neurons with well-defined morphology (D-4, D-5) while the superior colliculus contained clusters of cell with immature morphology (E, E-6).
Fig. 9
Fig. 9
GIFM of Wnt1 derived neurons and developing neural circuits in E12.5 Wnt1-CreERT;mGFP embryos. Tamoxifen was administered at E8.5 and Wnt1-CreERT;mGFP embryos were analyzed four days later. Whole-Mount GFP fluorescence was detected in the Mb, posterior Hb, and SC (A, B). Projections could be followed from the SC as they branched in the body wall (C) and innervated the forelimb (fl) (A, inset). A dense plexus located in the ventral Mb (D) is compared to evenly spaced radially oriented axonal branches in the dorsal Mb (D, E, arrows). In the SC region, the projections appeared more dorsal than those seen in En1Cre;mGFP embryos (F, brackets). Some of the projections may be Hb projections coursing in close proximity to the SC. In sagittal sections, neurons of the lateral-dorsal Mb (G) were located distal to the surface of the tissue but had elaborate morphology (G-1) with processes that spanned the outer ‘shell’ of the Mb and contacted the pial surface (G). In the ventral Mb (H) a cluster of β-gal+ cells (H-2, red) had projections that joined a thick fascicle running rostral-to-caudal in a zone distal to the ventricular zone (H, bracket). In the posterior Hb (I), projections were localized along the ventral half of the tissue (I-3). The projections connecting the lateral Hb and trigeminal ganglia (J) were readily discerned as were β-gal+ nuclei within the trigeminal ganglia (J). The neurons in the ganglia were largely bipolar (J-4). In the SC (K), neurons of the DRG were clearly marked (K-5) and had axons that traversed between intercostal domains innervating the lateral body wall (K, A, inset).
Fig. 10
Fig. 10
Wnt1-derived neural circuits of the trigeminal ganglia. The reference panel (reference) shows the various regions that we sampled by z-series acquisition using 1µm thick optical planes followed by 3-D reconstructions. Wnt1-derived neurons (nβ-gal+, red) in the trigeminal had fine axons that formed fascicles, which emanated from the trigeminal and connected with the rostral craniofacial regions (A, B). At the pontine flexure fate mapped axons (GFP+, green) were organized into mini-columns radially organized and perpendicular to the axons located at the periphery of the pontine flexure (C). The axons within the pontine flexure were also organized into discrete units that primarily bifurcated at a more interior position and ramified in the interior stratified portion of the lateral Hb (D). Neuronal cell bodies marked within the lateral-posterior Hb tended to have long sparse tangential fibers that were uniformly aligned (E). Within the craniofacial domain, the Wnt1-derived neurons of the trigeminal often had a small number of axons that emanated from the main fascicle, arborized, and formed an elaborate plexus (F). High magnification microscopy of single optical sections allowed us to determine that single projections from trigeminal neurons tended to fasciculate with axons passing in close proximity to the site from where they extended; the rings show examples of points of fasciculation (G). The projections within the pontine flexure showed a complex arrangement: axons connected to the trigeminal (arrowheads) often passed over the longitudinally-oriented axons (arrowheads) (H).

Similar articles

Cited by

References

    1. Ahn S, Joyner AL. Dynamic changes in the response of cells to positive hedgehog signaling during mouse limb patterning. Cell. 2004;118:505–516. - PubMed
    1. Ahn S, Joyner AL. In vivo analysis of quiescent adult neural stem cells responding to Sonic hedgehog. Nature. 2005;437:894–897. - PubMed
    1. Aronov S, Aranda G, Behar L, Ginzburg I. Axonal tau mRNA localization coincides with tau protein in living neuronal cells and depends on axonal targeting signal. J Neurosci. 2001;21:6577–6587. - PMC - PubMed
    1. Davidson D, Graham E, Sime C, Hill R. A gene with sequence similarity to Drosophila engrailed is expressed during the development of the neural tube and vertebrae in the mouse. Development. 1988;104:305–316. - PubMed
    1. Dymecki SM, Kim JC. Molecular neuroanatomy’s "Three Gs": a primer. Neuron. 2007;54:17–34. - PMC - PubMed

Publication types

MeSH terms

LinkOut - more resources