. 2009 Oct;35(10):1722-36.
doi: 10.1016/j.ultrasmedbio.2009.04.020. Epub 2009 Jul 17.

Investigations into pulsed high-intensity focused ultrasound-enhanced delivery: preliminary evidence for a novel mechanism

Affiliations

Investigations into pulsed high-intensity focused ultrasound-enhanced delivery: preliminary evidence for a novel mechanism

Hilary A Hancock et al. Ultrasound Med Biol. 2009 Oct.

Abstract

Pulsed high-intensity focused ultrasound (HIFU) exposures without ultrasound contrast agents have been used for noninvasively enhancing the delivery of various agents to improve their therapeutic efficacy in a variety of tissue models in a nondestructive manner. Despite the versatility of these exposures, little is known about the mechanisms by which their effects are produced. In this study, pulsed-HIFU exposures were given in the calf muscle of mice, followed by the administration of a variety of fluorophores, both soluble and particulate, by local or systemic injection. In vivo imaging (whole animal and microscopic) was used to quantify observations of increased extravasation and interstitial transport of the fluorophores as a result of the exposures. Histological analysis indicated that the exposures caused some structural alterations such as enlarged gaps between muscle fiber bundles. These effects were consistent with increasing the permeability of the tissues; however, they were found to be transient and reversed themselves gradually within 72 h. Simulations of radiation force-induced displacements and the resulting local shear strain they produced were carried out to potentially explain the manner by which these effects occurred. A better understanding of the mechanisms involved with pulsed HIFU exposures for noninvasively enhancing delivery will facilitate the process for optimizing their use.


Figures

Fig. 1
Fig. 1
Experimental setup for HIFU exposures. (Upper left) Water tank with probe and animal holder inserted vertically and attached to 3D stage. (Upper right) Zoom in of hatched region in upper left image showing the transducer positioned directly across from the mouse limb being targeted. Note, the head of the mouse is above the water line. (Bottom) B-mode ultrasound scans from the graphic user interface showing how the targeted muscle is positioned within the focal zone of the transducer. Raster points for treatment planning are added after animal positioning and image acquisition.
Fig. 2
Fig. 2
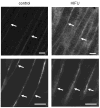
Representative in vivo images captured of fluorescently labeled lectin administered systemically in treated (HIFU) and untreated (control) muscle. Imaging was carried out immediately after treatment. Lower magnification images (top) show overall greater levels of signal in the treated tissue. In higher magnification images (bottom) capillaries appear to be broader and less delineated in the treated tissue compared to controls. Arrows indicate capillaries. Bar = 50 μm.
Fig. 3
Fig. 3
In vivo images captured at early and late time points of fluorescently labeled nanospheres (100 nm) administered systemically in treated (HIFU) and untreated (control) muscle. At 0.5 hrs nanospheres can be seen restricted to the vasculature in the untreated tissue (arrows); however substantial aggregations occur in the treated tissue that appeared broader than the confines of the capillaries. At 24 hrs nanospheres are no longer visible in the untreated tissue, and are now more evenly distributed in the treated tissue. Bar = 50 μm.
Fig. 4
Fig. 4
Relative nanoparticle concentration in treated and untreated muscle, where a systemic administration of either 100 nm or 200 nm nanospheres was given at 0, 24, and 48 hrs. post-HIFU exposure. Three representative vivo images were captured for each tissue analyzed, and standard image processing techniques were used for quantitating fluorescent signal density. Greater relative concentration was observed for the 100 nm nanospheres compared to the 200 nm nanospheres at each of the time points. A general trend was observed for both nanospheres sizes of decreasing concentration with increasing delay between HIFU exposures and administrations. Significant differences between treated and untreated tissue were found at each time point for both nanospheres sizes (p < 0.05, n = 10).
Fig. 5
Fig. 5
Distributions of fluorescently labeled albumin (A) and nanospheres (N) co-administered locally by direct injection in treated (HIFU) and untreated (control) muscle. (Upper images) In vivo images of the flanks captured for the albumin and nanospheres using multi-spectral imaging. Vertical arrows indicate the site of injection. Rectangles indicate region of treatment of the HIFU exposures. Horizontal arrows show accumulation of the fluorophores in the untreated tissue, at the tip of the injection, being noticeably greater than in the treated tissue. Bar = 2 mm. (Lower left) Spatial distribution of both fluorophores in the treated and untreated tissue. A significant increase in distribution of the nanospheres was found in the treated tissue compared to untreated (p = 0.01, n = 10). Although a trend of greater distribution of the albumin was also observed in the treated tissue, this was not significantly different than in the controls. (Lower right) Normalization of nanosphere distribution to that of the albumin. Normalized distribution in the HIFU treated tissue was significantly greater than in the untreated muscle (p = 0.04, n = 10).
Fig. 6
Fig. 6
Representative histological sections of treated (HIFU) and untreated (control) muscle stained with hematoxalin and eosin. (Upper images) Tissues were sampled at 0, 24, 48 and 72 hrs post-HIFU (n = 5). Arrows indicate enlarged gaps between the muscle fibers in the treated tissue (compared to controls), which appear largest at 0 hrs and tend to decrease in size over time. (Lower images) Sections of samples taken in treated tissue at 0 hrs. (a) Large blood vessels (arrows) were not found to be disrupted by the exposures; (b) the outer surface of the fibers were also observed to be intact, however the connective tissue (arrows) between them was disrupted where enlarged gaps occurred; (c) large numbers of capillaries were found to disrupted at 0 hrs, but rarely seen in tissues sampled at later time points. An intact endothelial cell (right arrow) is seen in a disrupted capillary, as well as extravasated red blood cells (left arrow). Extravasated red blood cells are also seen between muscle fibers at 0 hrs in the upper images. Bar = 100 μm.
Figure 7
Figure 7
Simulated displacement and von Mises strains dynamically induced using a single 50 HIFU pulse in an isotropic, linear elastic solid (E = 27 kPa, ν = 0.499). (upper left) Axial displacement (directed away from the HIFU piston) at the focal point. The cessation of the pulse is at 50 ms (indicated by the dashed vertical line). (upper right) The axial displacement field during steady-state sonication shows the displacement concentrated around the focal zone (a & b), while after cessation (c & d) of the sonication shear waves are released into the adjacent tissue outside the focal zone. (bottom) The lateral extent of the displacement (left) and von Mises strain (right) fields during the sonication (< 50 ms) and after cessation of the sonication (> 50 ms).
Figure 8
Figure 8
Experimental displacement data acquired in mouse skeletal muscle in situ. (bottom) Mean focal point displacement through time immediately after cessation of a 50 ms HIFU pulse at three different power levels: 30 W (n = 6), 40 W (n = 4) & 50 W (n = 6). Sham pulses (0 W, n = 5) indicate the noise associated with data acquisition. The relaxation time back to the unperturbed state (0 μm) is 6–8 ms. (inset) Peak focal point displacement generated by a 50 ms HIFU pulse as a function of power (30, 40 & 50 W). Error bars (SE) represent the variability among different measurements.

Similar articles

Cited by

References

    1. Baker BA, Mercer RR, Geronilla KB, Kashon ML, Miller GR, Cutlip RG. Stereological analysis of muscle morphology following exposure to repetitive stretch-shortening cycles in a rat model. Appl Physiol Nutr Metab. 2006;31:167–79. - PubMed
    1. Baker BA, Mercer RR, Geronilla KB, Kashon ML, Miller GR, Cutlip RG. Impact of repetition number on muscle performance and histological response. Med Sci Sports Exerc. 2007;39:1275–81. - PubMed
    1. Bercoff J, Tanter M, Fink M. Supersonic shear imaging: a new technique for soft tissue elasticity mapping. IEEE Trans Ultrason Ferroelectr Freq Control. 2004;51:396–409. - PubMed
    1. Clarkson PM, Hubal MJ. Exercise-induced muscle damage in humans. Am J Phys Med Rehabil. 2002;81:S52–69. - PubMed
    1. Clement GT. Perspectives in clinical uses of high-intensity focused ultrasound. Ultrasonics. 2004;42:1087–93. - PubMed

Publication types

MeSH terms