

Modeling plan-related clinical complications using machine learning tools in a multiplan IMRT framework
- PMID: 19616747
- PMCID: PMC3346958
- DOI: 10.1016/j.ijrobp.2009.02.065
Modeling plan-related clinical complications using machine learning tools in a multiplan IMRT framework
Abstract
Purpose: To predict organ-at-risk (OAR) complications as a function of dose-volume (DV) constraint settings without explicit plan computation in a multiplan intensity-modulated radiotherapy (IMRT) framework.
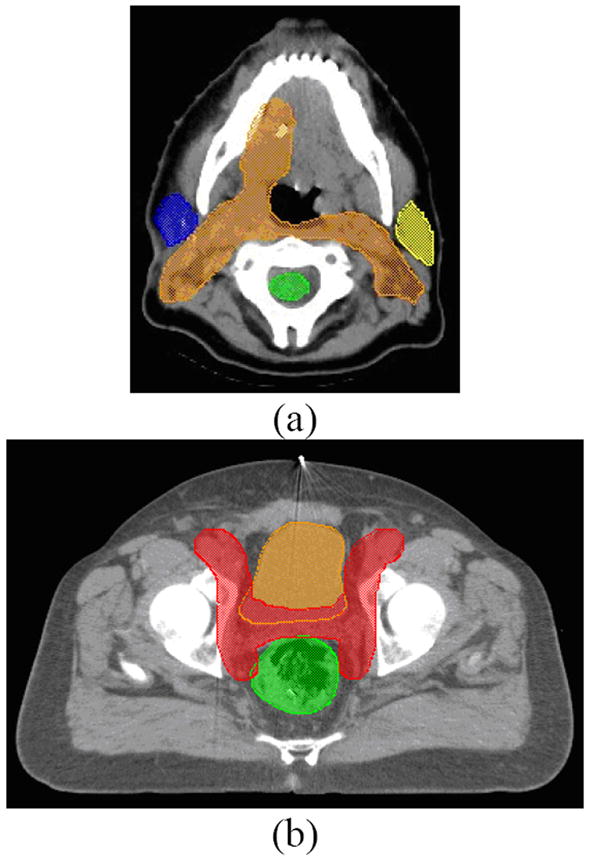
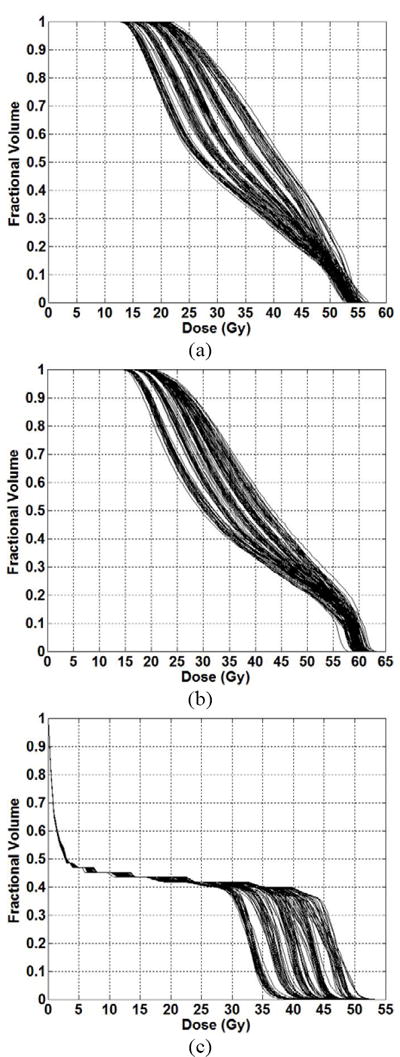
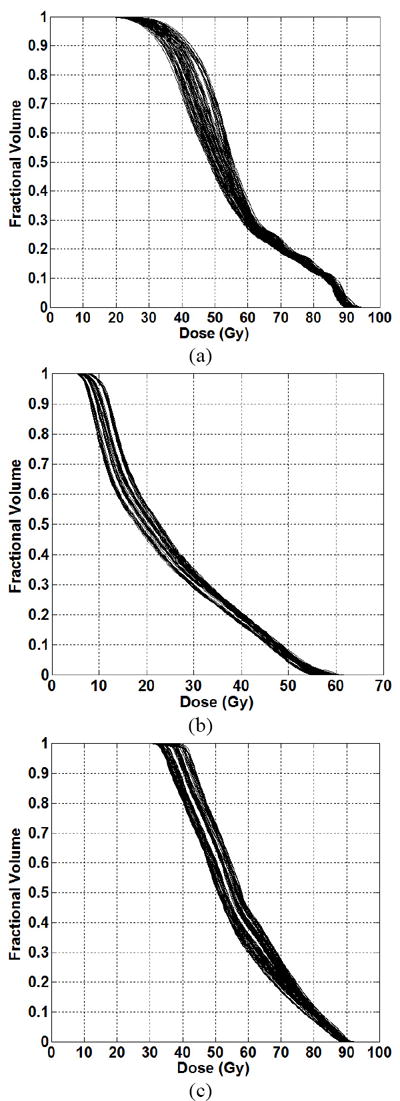
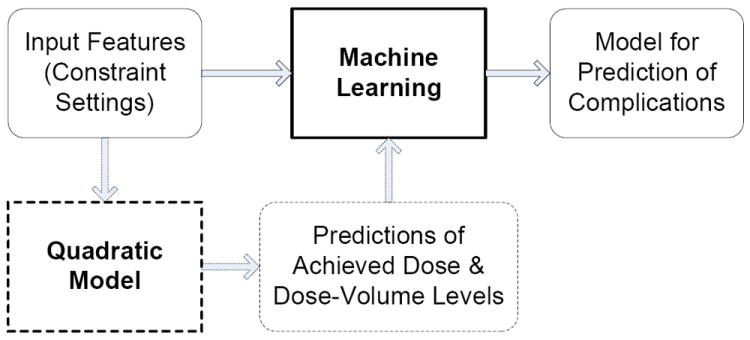
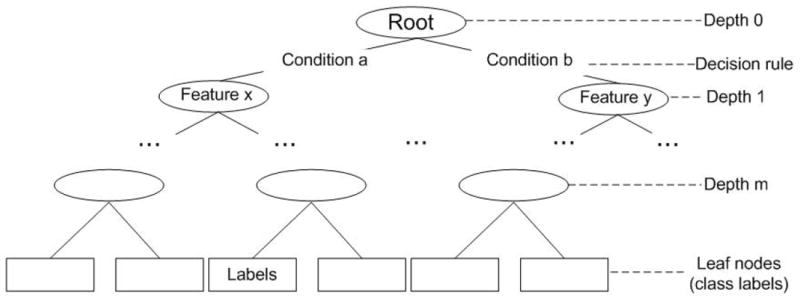
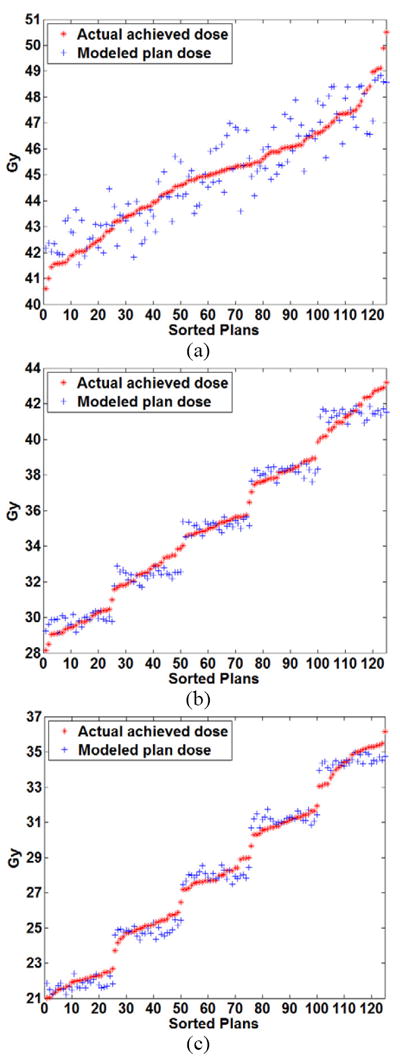
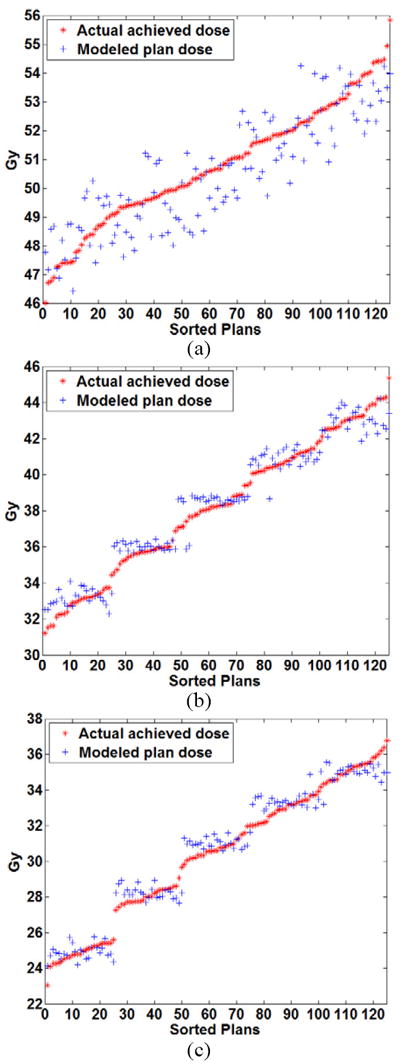
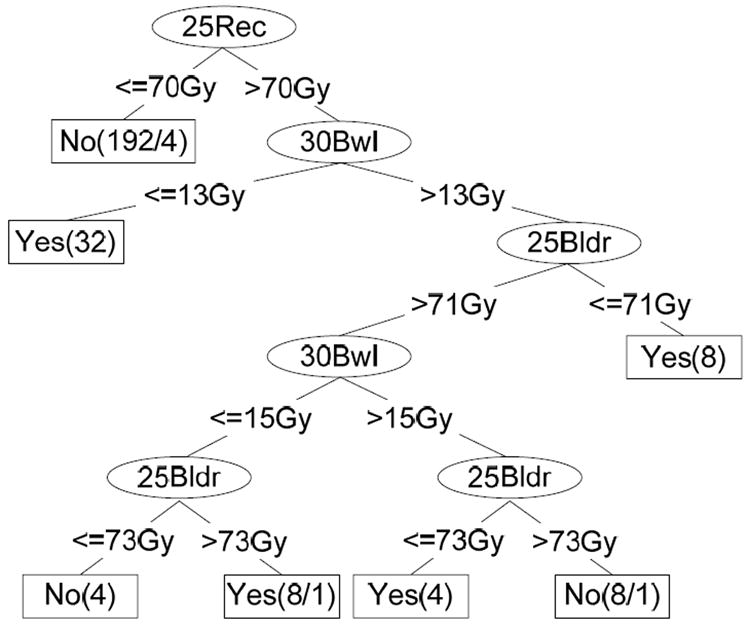
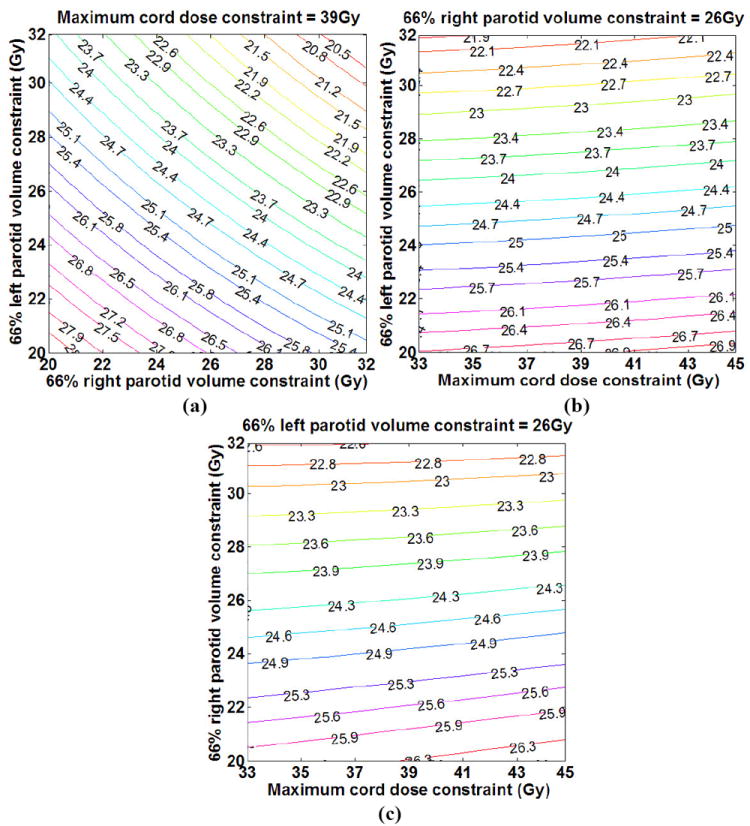
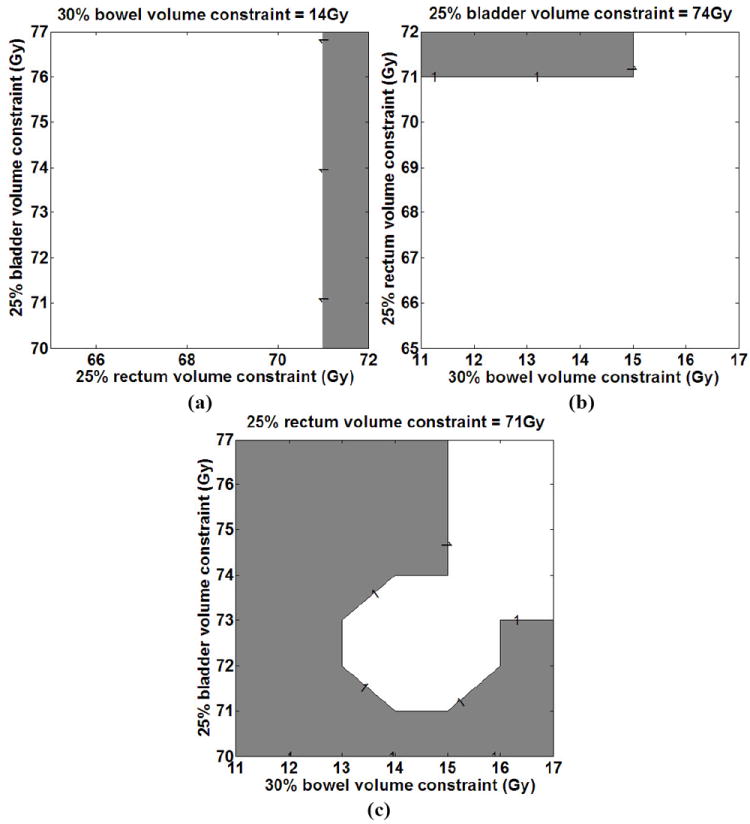
Methods and materials: Several plans were generated by varying the DV constraints (input features) on the OARs (multiplan framework), and the DV levels achieved by the OARs in the plans (plan properties) were modeled as a function of the imposed DV constraint settings. OAR complications were then predicted for each of the plans by using the imposed DV constraints alone (features) or in combination with modeled DV levels (plan properties) as input to machine learning (ML) algorithms. These ML approaches were used to model two OAR complications after head-and-neck and prostate IMRT: xerostomia, and Grade 2 rectal bleeding. Two-fold cross-validation was used for model verification and mean errors are reported.
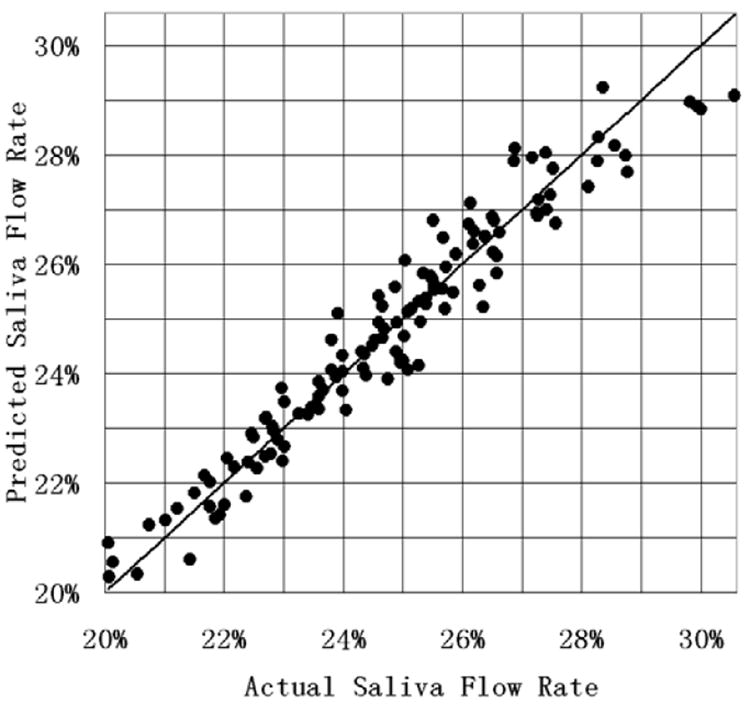
Results: Errors for modeling the achieved DV values as a function of constraint settings were 0-6%. In the head-and-neck case, the mean absolute prediction error of the saliva flow rate normalized to the pretreatment saliva flow rate was 0.42% with a 95% confidence interval of (0.41-0.43%). In the prostate case, an average prediction accuracy of 97.04% with a 95% confidence interval of (96.67-97.41%) was achieved for Grade 2 rectal bleeding complications.
Conclusions: ML can be used for predicting OAR complications during treatment planning allowing for alternative DV constraint settings to be assessed within the planning framework.
Conflict of interest statement
Figures
Similar articles
-
The minimum knowledge base for predicting organ-at-risk dose-volume levels and plan-related complications in IMRT planning.Phys Med Biol. 2010 Apr 7;55(7):1935-47. doi: 10.1088/0031-9155/55/7/010. Epub 2010 Mar 12. Phys Med Biol. 2010. PMID: 20224155 Free PMC article.
-
Experience-based quality control of clinical intensity-modulated radiotherapy planning.Int J Radiat Oncol Biol Phys. 2011 Oct 1;81(2):545-51. doi: 10.1016/j.ijrobp.2010.11.030. Epub 2011 Jan 27. Int J Radiat Oncol Biol Phys. 2011. PMID: 21277097
-
Modeling the dosimetry of organ-at-risk in head and neck IMRT planning: an intertechnique and interinstitutional study.Med Phys. 2013 Dec;40(12):121704. doi: 10.1118/1.4828788. Med Phys. 2013. PMID: 24320490 Free PMC article.
-
A multiplan treatment-planning framework: a paradigm shift for intensity-modulated radiotherapy.Int J Radiat Oncol Biol Phys. 2007 Jul 15;68(4):1178-89. doi: 10.1016/j.ijrobp.2007.02.051. Epub 2007 May 23. Int J Radiat Oncol Biol Phys. 2007. PMID: 17512129
-
Efficiency of biological versus physical optimization for single-arc VMAT for prostate and head and neck cases.J Appl Clin Med Phys. 2014 Jul 8;15(4):4514. doi: 10.1120/jacmp.v15i4.4514. J Appl Clin Med Phys. 2014. PMID: 25207394 Free PMC article.
Cited by
-
IMRT QA using machine learning: A multi-institutional validation.J Appl Clin Med Phys. 2017 Sep;18(5):279-284. doi: 10.1002/acm2.12161. Epub 2017 Aug 17. J Appl Clin Med Phys. 2017. PMID: 28815994 Free PMC article.
-
Machine Learning-Based Models for Prediction of Toxicity Outcomes in Radiotherapy.Front Oncol. 2020 Jun 5;10:790. doi: 10.3389/fonc.2020.00790. eCollection 2020. Front Oncol. 2020. PMID: 32582539 Free PMC article. Review.
-
The minimum knowledge base for predicting organ-at-risk dose-volume levels and plan-related complications in IMRT planning.Phys Med Biol. 2010 Apr 7;55(7):1935-47. doi: 10.1088/0031-9155/55/7/010. Epub 2010 Mar 12. Phys Med Biol. 2010. PMID: 20224155 Free PMC article.
-
Automatic assessment of average diaphragm motion trajectory from 4DCT images through machine learning.Biomed Phys Eng Express. 2015 Dec 1;1(4):045015. doi: 10.1088/2057-1976/1/4/045015. Epub 2015 Dec 29. Biomed Phys Eng Express. 2015. PMID: 27110388 Free PMC article.
-
Radiomics and Machine Learning for Radiotherapy in Head and Neck Cancers.Front Oncol. 2019 Mar 27;9:174. doi: 10.3389/fonc.2019.00174. eCollection 2019. Front Oncol. 2019. PMID: 30972291 Free PMC article. Review.
References
-
- Gopal R, Starkschall G. Plan space: representation of treatment plans in multidimensional space. Int J Radiat Oncol Biol Phys. 2002;53:1328–36. - PubMed
-
- Rosen I, Liu HH, Childress N, et al. Interactively exploring optimized treatment plans. Int J Radiat Oncol Biol Phys. 2005;61:570–82. - PubMed
-
- Zhang X, Wang X, Dong L, et al. A sensitivity-guided algorithm for automated determination of IMRT objective function parameters. Med Phys. 2006;33:2935–2944. - PubMed
-
- Yu Y. Multiobjective decision theory for computational optimization in radiation therapy. Medical Physics. 1997;24:1445–1454. - PubMed
-
- Xing L, Li JG, Donaldson S, et al. Optimization of importance factors in inverse planning. Phys Med Biol. 1999;44:2525–2536. - PubMed
Publication types
MeSH terms
Grants and funding
LinkOut - more resources
Full Text Sources
Other Literature Sources
