Cortical evoked potentials to an auditory illusion: binaural beats
- PMID: 19616993
- PMCID: PMC2741401
- DOI: 10.1016/j.clinph.2009.06.014
Cortical evoked potentials to an auditory illusion: binaural beats
Abstract
Objective: To define brain activity corresponding to an auditory illusion of 3 and 6Hz binaural beats in 250Hz or 1000Hz base frequencies, and compare it to the sound onset response.
Methods: Event-Related Potentials (ERPs) were recorded in response to unmodulated tones of 250 or 1000Hz to one ear and 3 or 6Hz higher to the other, creating an illusion of amplitude modulations (beats) of 3Hz and 6Hz, in base frequencies of 250Hz and 1000Hz. Tones were 2000ms in duration and presented with approximately 1s intervals. Latency, amplitude and source current density estimates of ERP components to tone onset and subsequent beats-evoked oscillations were determined and compared across beat frequencies with both base frequencies.
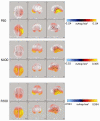
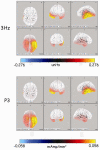
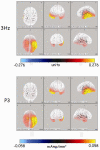
Results: All stimuli evoked tone-onset P(50), N(100) and P(200) components followed by oscillations corresponding to the beat frequency, and a subsequent tone-offset complex. Beats-evoked oscillations were higher in amplitude with the low base frequency and to the low beat frequency. Sources of the beats-evoked oscillations across all stimulus conditions located mostly to left lateral and inferior temporal lobe areas in all stimulus conditions. Onset-evoked components were not different across stimulus conditions; P(50) had significantly different sources than the beats-evoked oscillations; and N(100) and P(200) sources located to the same temporal lobe regions as beats-evoked oscillations, but were bilateral and also included frontal and parietal contributions.
Conclusions: Neural activity with slightly different volley frequencies from left and right ear converges and interacts in the central auditory brainstem pathways to generate beats of neural activity to modulate activities in the left temporal lobe, giving rise to the illusion of binaural beats. Cortical potentials recorded to binaural beats are distinct from onset responses.
Significance: Brain activity corresponding to an auditory illusion of low frequency beats can be recorded from the scalp.
Figures


References
-
- Attias J, Urbach D, Gold S, Shemesh Z. Auditory event related potentials in chronic tinnitus patients with noise induced hearing loss. Hear. Res. 1993;71:106–113. - PubMed
-
- Barr DF, Mullin TA, Herbert PS. Application of binaural beat phenomenon with aphasic patients. Arch Otolaryngol. 1977;103:192–194. - PubMed
-
- Draganova R, Ross B, Wollbrink A, Pantev C. Cortical steady-state responses to central and peripheral auditory beats. Cereb Cortex. 2008;18:1193–11200. - PubMed
-
- Fritze W. On binaural beats. Arch Otorhinolaryngol. 1985;242:301–303. - PubMed
Publication types
MeSH terms
Grants and funding
LinkOut - more resources
Full Text Sources
Other Literature Sources
Research Materials

