. 2009 Dec 1;84(3):387-95.
doi: 10.1093/cvr/cvp246. Epub 2009 Jul 17.

Redox modification of ryanodine receptors underlies calcium alternans in a canine model of sudden cardiac death

Affiliations

Redox modification of ryanodine receptors underlies calcium alternans in a canine model of sudden cardiac death

Andriy E Belevych et al. Cardiovasc Res. .

Abstract

Aims: Although cardiac alternans is a known predictor of lethal arrhythmias, its underlying causes remain largely undefined in disease settings. The potential role of, and mechanisms responsible for, beat-to-beat alternations in the amplitude of systolic Ca(2+) transients (Ca(2+) alternans) was investigated in a canine post-myocardial infarction (MI) model of sudden cardiac death (SCD).

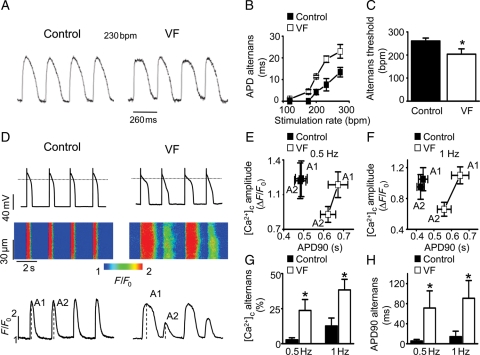
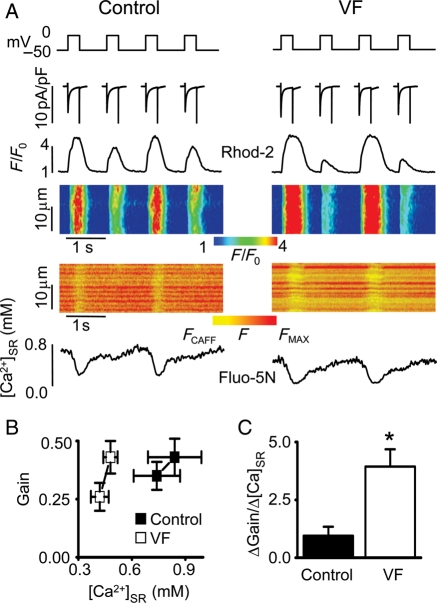
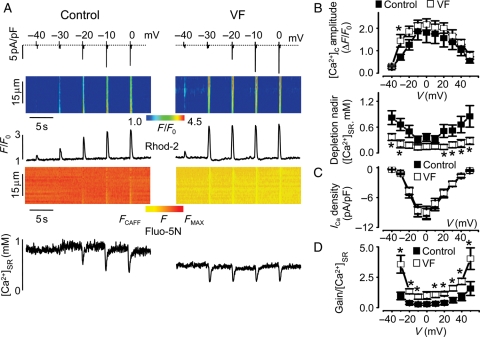
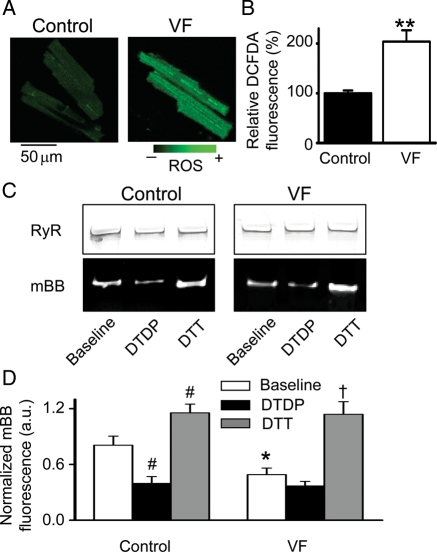
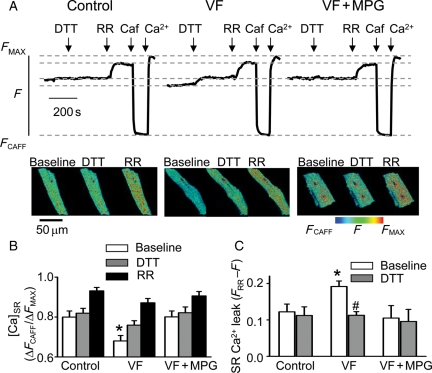
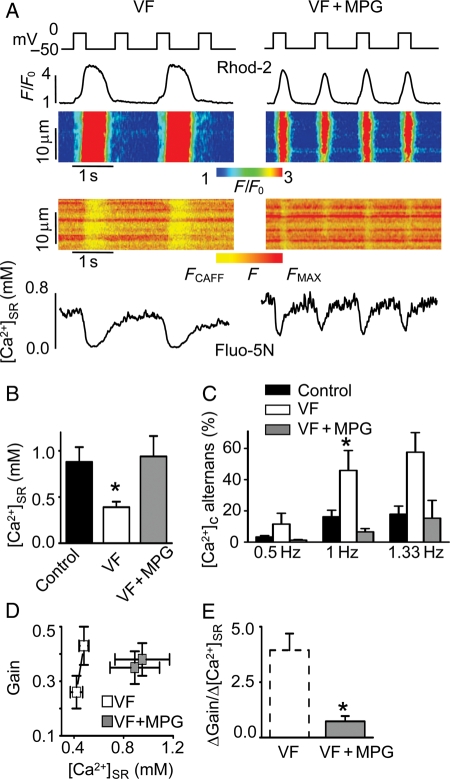
Methods and results: Post-MI dogs had preserved left ventricular (LV) function and susceptibility to ventricular fibrillation (VF) during exercise. LV wedge preparations from VF dogs were more susceptible to action potential (AP) alternans and the frequency-dependence of Ca(2+) alternans was shifted towards slower rates in myocytes isolated from VF dogs relative to controls. In both groups of cells, cytosolic Ca(2+) transients ([Ca(2+)](c)) alternated in phase with changes in diastolic Ca(2+) in sarcoplasmic reticulum ([Ca(2+)](SR)), but the dependence of [Ca(2+)](c) amplitude on [Ca(2+)](SR) was steeper in VF cells. Abnormal ryanodine receptor (RyR) function in VF cells was indicated by increased fractional Ca(2+) release for a given amplitude of Ca(2+) current and elevated diastolic RyR-mediated SR Ca(2+) leak. SR Ca(2+) uptake activity did not differ between VF and control cells. VF myocytes had an increased rate of reactive oxygen species production and increased RyR oxidation. Treatment of VF myocytes with reducing agents normalized parameters of Ca(2+) handling and shifted the threshold of Ca(2+) alternans to higher frequencies.

Conclusion: Redox modulation of RyRs promotes generation of Ca(2+) alternans by enhancing the steepness of the Ca(2+) release-load relationship and thereby providing a substrate for post-MI arrhythmias.


Figures

Figure 1
Figure 1
Increased susceptibility to AP and Ca2+ alternans in VF hearts. (A) Representative mid-myocardial APs recorded at a stimulation rate of 230 bpm from a control and VF heart. (B) Dependence of the amplitude of APD alternans on stimulation rate recorded in VF and control wedge preparations. (C) APD alternans threshold in VF hearts (203 ± 23 bpm) is significantly lower than the threshold recorded in control (261 ± 12 bpm; *P < 0.05 vs. control). (D) Representative recordings of membrane potential with corresponding line-scan images and temporal profiles of Fluo-3 fluorescence in control and VF myocytes. (E and F) Average amplitudes of [Ca2+]c and duration of corresponding APs were measured with consecutive stimuli in control and VF cells paced with 0.5 and 1 Hz, respectively. A1 and A2 are [Ca2+]c amplitudes of two consecutive stimuli, as shown in (D). Average amplitudes of [Ca2+]c (G) and APD90 (H) alternans in control and VF myocytes were measured at indicated stimulation frequencies. *P < 0.05, vs. control.
Figure 2
Figure 2
Properties of SR Ca2+ release in control and VF myocytes displaying Ca2+ alternans during 1 Hz stimulation. (A) Representative ICa traces and corresponding line-scan images and temporal profiles of Rhod-2 and Fluo-5N fluorescence recorded in voltage-clamped control and VF cells. Upper traces show voltage protocol used. (B) Dependence of the SR Ca2+ release gain function ([Ca2+]c amplitude/density of peak ICa) on [Ca2+]SR measured with consecutive stimuli in control and VF cells paced at 1 Hz. (C) The slope of gain–[Ca2+]SR function, calculated from the data presented in (B), was 1.0 ± 0.4 (n = 9) in control and 3.9 ± 0.8 (n = 10) in VF myocytes, respectively. *P < 0.05 vs. control.
Figure 3
Figure 3
Voltage-dependent characteristics of Ca2+-induced Ca2+ release in control and VF myocytes. (A) Representative traces of ICa, line-scan images and temporal profiles of Rhod-2 and Fluo-5N fluorescence recorded in control and VF cells. ICa and corresponding [Ca2+]c were evoked by depolarizing steps from a holding potential of −50 mV to the indicated potentials. (B) Voltage-dependence of the amplitude of [Ca2+]c and nadir of SR Ca2+ depletion in control and VF cells.*P < 0.05 vs. control. Voltage-dependence of the peak ICa (C) and of the gain/diastolic [Ca2+]SR ratio (D). *P < 0.05 vs. control.
Figure 4
Figure 4
Increased production of ROS and RyR oxidation in VF hearts. (A) Representative images of ROS-sensitive indicator DCFDA loaded into myocytes from normal and VF hearts. (B) Relative normalized DCFDA fluorescence in myocytes from control (n = 25) and VF hearts (n = 31). **P < 0.01 vs. control. Fluorescence values were normalized to the signal measured in the presence of 10 mM of H2O2 and presented relative to control (100%). (C) Representative Coomassie Blue-stained gels (upper panels) and corresponding mBB fluorescence intensity (lower panels) of RyR from normal and VF hearts measured under baseline conditions and after 30 min incubation with of 0.2 mM DTDP or 5 mM DTT. (D) Relative free thiol content of RyRs from control vs. VF samples obtained by normalizing mBB fluorescence to RyR amount determined using Coomassie Blue staining of the gels run in parallel. *P < 0.05 baseline VF (n = 7) vs. baseline control (n = 9); #P < 0.05 vs. baseline control; P < 0.05 vs. baseline VF.
Figure 5
Figure 5
Reducing agents normalize [Ca2+]SR in permeabilized VF myocytes by inhibiting RR-sensitive SR Ca2+ leak. (A) Time-dependent profiles of intra-SR Fluo-5N signals recorded before and after the application of 1 mM DTT and 30 µmol/L RR in control, VF cells, and in VF cells pre-treated with 1 mM N-(2-mercapto-propionyl)glycine (MPG). Representative XY-images of Fluo-5N signal of a control, a VF cell, and a VF cell pre-treated with MPG recorded under specified conditions. (B) Average data of normalized Fluo-5N signal in control (n = 11), VF cells (n = 12), and VF cells pre-treated with MPG (n = 9) recorded in the absence and presence of DTT and RR. *P < 0.05 baseline VF vs. baseline control and VF with MPG. (C) SR Ca2+ leak, defined as the difference in Fluo-5N fluorescence recorded with (FRR) and without (F) RR, under baseline conditions and in the presence of DTT in control, VF, and MPG-treated VF myocytes. *P < 0.05 vs. baseline control; #P < 0.05 vs. baseline VF.
Figure 6
Figure 6
A reducing agent normalizes [Ca2+]SR and lessens the amplitude of Ca2+ alternans in patch-clamped VF myocytes. (A) Representative line-scan images and temporal profiles of Rhod-2 and Fluo-5N fluorescence recorded in voltage-clamped VF cells recorded in the absence and presence of MPG, a reducing agent. Cells were stimulated at 1 Hz frequency. Upper traces show voltage protocol used. (B) Average values of end-diastolic [Ca2+]SR were 0.88 ± 0.16, 0.41 ± 0.06, and 0.94 ± 0.22 mM in control (n = 8), in VF myocytes (n = 10), and in VF myocytes treated with 750 µM MPG (n = 9), respectively. *P < 0.05 vs. control. (C) Average amplitude of [Ca2+]c alternans recorded at the indicated frequency of stimulation in voltage-clamped control cells (n = 4–13), VF cells (n = 8–11), and VF cells treated with MPG (n = 6–9). *P < 0.05 vs. 1 Hz control and 1 Hz VF cells treated with MPG. (D) Dependence of the SR Ca2+ release gain function ([Ca2+]c amplitude/density of peak ICa) on [Ca2+]SR measured for consecutive stimuli in VF cells in the absence and presence of MPG. Cells were paced at 1 Hz. (E) The slope of gain–[Ca2+]SR function, calculated from the data presented (D), was 0.7 ± 0.2 (n = 9) in VF myocytes treated with MPG. *P < 0.05 vs. untreated VF.

Comment in

References

    1. Moss AJ, Zareba W, Hall WJ, Klein H, Wilber DJ, Cannom DS, et al. Prophylactic implantation of a defibrillator in patients with myocardial infarction and reduced ejection fraction. N Engl J Med. 2002;346:877–883. - PubMed
    1. Bunch TJ, Hohnloser SH, Gersh BJ. Mechanisms of sudden cardiac death in myocardial infarction survivors: insights from the randomized trials of implantable cardioverter-defibrillators. Circulation. 2007;115:2451–2457. - PubMed
    1. Clements-Jewery H, Andrag E, Curtis MJ. Druggable targets for sudden cardiac death prevention: lessons from the past and strategies for the future. Curr Opin Pharmacol. 2009;9:146–153. - PubMed
    1. Janse MJ, Wit AL. Electrophysiological mechanisms of ventricular arrhythmias resulting from myocardial ischemia and infarction. Physiol Rev. 1989;69:1049–1169. - PubMed
    1. Walker ML, Rosenbaum DS. Repolarization alternans: implications for the mechanism and prevention of sudden cardiac death. Cardiovasc Res. 2003;57:599–614. - PubMed

Publication types

MeSH terms

Substances