. 2009 Sep;37(17):5610-8.
doi: 10.1093/nar/gkp573. Epub 2009 Jul 17.

Importance of randomization in microarray experimental designs with Illumina platforms

Affiliations

Importance of randomization in microarray experimental designs with Illumina platforms

Ricardo A Verdugo et al. Nucleic Acids Res. 2009 Sep.

Abstract

Measurements of gene expression from microarray experiments are highly dependent on experimental design. Systematic noise can be introduced into the data at numerous steps. On Illumina BeadChips, multiple samples are assayed in an ordered series of arrays. Two experiments were performed using the same samples but different hybridization designs. An experiment confounding genotype with BeadChip and treatment with array position was compared to another experiment in which these factors were randomized to BeadChip and array position. An ordinal effect of array position on intensity values was observed in both experiments. We demonstrate that there is increased rate of false-positive results in the confounded design and that attempts to correct for confounded effects by statistical modeling reduce power of detection for true differential expression. Simple analysis models without post hoc corrections provide the best results possible for a given experimental design. Normalization improved differential expression testing in both experiments but randomization was the most important factor for establishing accurate results. We conclude that lack of randomization cannot be corrected by normalization or by analytical methods. Proper randomization is essential for successful microarray experiments.


Figures

Figure 1.
Figure 1.
Experimental design. Layout of samples for the Confounded and Randomized experiments. Black rectangles represent BeadChips. Sentrix Position for individual arrays are displayed along the left side of BeadChips (A–H). Each experiment used two BeadChips. Colors represent genotype [blue = C57BL/6J (B); green = C57BL/6J-chrYA/J/NaJ (BY)] and castration treatment [yellow = intact (I); red = castrated (C)].
Figure 2.
Figure 2.
Boxplot for raw data from the both experiments. Outliers are not shown for clarity. Boxplots of raw intensity values for negative probes in the Confounded and Randomized experiments are shown by position in the four Chips. Color differentiates castration treatment (yellow = castrated; green = intact). Blue lines are best linear fit on the medians by position.
Figure 3.
Figure 3.
Confounded experiment is enriched with false-positive results. Genes selected for differential expression in two replicated experiments. Genes were selected by the UnAdj model on normalized data. Venn diagrams group number of unique genes selected (a–c) and GO Biological Processes associated to those genes (d–f).
Figure 4.
Figure 4.
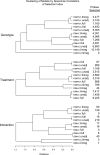
Hierarchical clustering of fitted models for adjustment of chip and position effects (Table 1). Models distance was measured as 1-Spearman correlation between P-values. Negative correlations produce distances higher than 1. Branches are labeled to indicate normalization method (norm, raw), experiment (c,r) and analysis model (unadj, linreg, full). Number of probes selected at FDR < 0.1 are shown at right.
Figure 5.
Figure 5.
Variance due to chip effects. The variance component associated to chip effects (S2chip) was estimated by REML from the Full model in raw and normalized data from the Randomized experiment. The histogram shows the distribution of S2chip/S2total across probes.
Figure 6.
Figure 6.
Association between treatment and position effects introduced by a confounded design. Scatter plots show position in Chip 2 (Confounded) and Chip 4 (Randomized) versus treatment effects in the BY genotype (Treatment_BY) from each experiment. Dotted blue lines cross the y- and x-axis at 0. Solid blue lines denote the median position (vertical) and Treatment_BY effects (horizontal).

References

    1. Fisher RA. 6th. London, UK: Olivier and Boyd; 1951. The design of experiments.
    1. Rubin DB. For objective causal inference, design trumps analysis. Ann. Appl. Stat. 2008;2:808–840.
    1. Lehmann E, Romano JP. Testing Statistical Hypotheses. 3rd. New York, USA: Springer; 2008.
    1. Draghici S. Data Analysis Tolls for DNA Microarrays. Boca Raton, FL: Chapman and Hall/CRC; 2003. p. 196.
    1. Churchill GA. Fundamentals of experimental design for cDNA microarrays. Nat. Genet. 2002;32(Suppl):490–495. - PubMed