

Direct evidence for a dry molten globule intermediate during the unfolding of a small protein
- PMID: 19617531
- PMCID: PMC2718347
- DOI: 10.1073/pnas.0905744106
Direct evidence for a dry molten globule intermediate during the unfolding of a small protein
Abstract
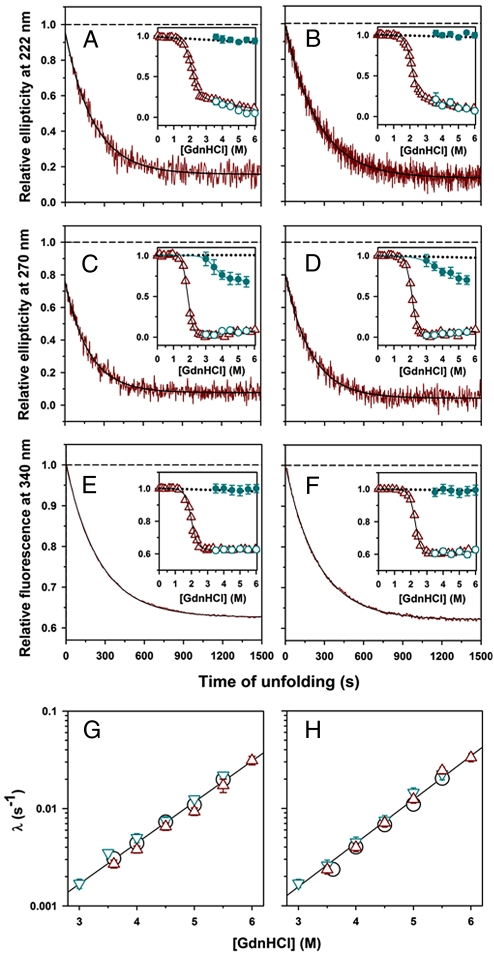
Little is known about how proteins begin to unfold. In particular, how and when water molecules penetrate into the protein interior during unfolding, thereby enabling the dissolution of specific structure, is poorly understood. The hypothesis that the native state expands initially into a dry molten globule, in which tight packing interactions are broken, but whose hydrophobic core has not expanded sufficiently to be able to absorb water molecules, has very little experimental support. Here, we report our analysis of the earliest observable events during the unfolding of single chain monellin (MNEI), a small plant protein. Far- and near-UV circular dichroism measurements of GdnHCl-induced unfolding indicate that a molten globule intermediate forms initially, before the major slow unfolding reaction commences. Steady-state fluorescence resonance energy transfer measurements show that the C-terminal end of the single helix of MNEI initially moves rapidly away from the single tryptophan residue that is close to the N-terminal end of the helix. The average end-to-end distance of the protein also expands during unfolding to the molten globule intermediate. At this time, water has yet to penetrate the protein core, according to the evidence from intrinsic tryptophan fluorescence and 8-anilino-1-naphthalenesulfonic acid fluorescence-monitored kinetic unfolding measurements. Our results therefore provide direct evidence for a dry molten globule intermediate at the initial stage of unfolding. Our results further suggest that the structural transition between the native and dry molten globule states could be an all-or-none transition, whereas further swelling of the globule appears to occur gradually.
Conflict of interest statement
The authors declare no conflict of interest.
Figures


Similar articles
-
Characterization of the folding and unfolding reactions of single-chain monellin: evidence for multiple intermediates and competing pathways.Biochemistry. 2007 Oct 23;46(42):11727-43. doi: 10.1021/bi701142a. Epub 2007 Sep 29. Biochemistry. 2007. PMID: 17902706
-
Unfolding of a small protein proceeds via dry and wet globules and a solvated transition state.Biophys J. 2013 Nov 19;105(10):2392-402. doi: 10.1016/j.bpj.2013.09.048. Biophys J. 2013. PMID: 24268151 Free PMC article.
-
Equilibrium and kinetics of the folding of equine lysozyme studied by circular dichroism spectroscopy.J Mol Biol. 1998;283(1):265-77. doi: 10.1006/jmbi.1998.2100. J Mol Biol. 1998. PMID: 9761689
-
Dry Molten Globule-Like Intermediates in Protein Folding, Function, and Disease.J Phys Chem B. 2022 Nov 3;126(43):8614-8622. doi: 10.1021/acs.jpcb.2c04991. Epub 2022 Oct 26. J Phys Chem B. 2022. PMID: 36286394 Review.
-
Molten globule-state protein structure: Perspectives from food processing applications.Food Res Int. 2024 Dec;198:115318. doi: 10.1016/j.foodres.2024.115318. Epub 2024 Nov 12. Food Res Int. 2024. PMID: 39643361 Review.
Cited by
-
The Molten Globule State of a Globular Protein in a Cell Is More or Less Frequent Case Rather than an Exception.Molecules. 2022 Jul 7;27(14):4361. doi: 10.3390/molecules27144361. Molecules. 2022. PMID: 35889244 Free PMC article. Review.
-
α-Synuclein aggregation nucleates through liquid-liquid phase separation.Nat Chem. 2020 Aug;12(8):705-716. doi: 10.1038/s41557-020-0465-9. Epub 2020 Jun 8. Nat Chem. 2020. PMID: 32514159
-
Site-specific hydration dynamics in the nonpolar core of a molten globule by dynamic nuclear polarization of water.J Am Chem Soc. 2011 Apr 20;133(15):5987-95. doi: 10.1021/ja111515s. Epub 2011 Mar 28. J Am Chem Soc. 2011. PMID: 21443207 Free PMC article.
-
Protein folding - seeing is deceiving.Protein Sci. 2021 Aug;30(8):1606-1616. doi: 10.1002/pro.4096. Epub 2021 May 7. Protein Sci. 2021. PMID: 33938055 Free PMC article.
-
How cooperative are protein folding and unfolding transitions?Protein Sci. 2016 Nov;25(11):1924-1941. doi: 10.1002/pro.3015. Epub 2016 Sep 13. Protein Sci. 2016. PMID: 27522064 Free PMC article. Review.
References
-
- Kauzmann W. Some factors in the interpretation of protein denaturation. Adv Protein Chem. 1959;14:l–63. - PubMed
-
- Tanford C. Protein denaturation. Adv Protein Chem. 1968;23:121–242. - PubMed
-
- Tanford C. Protein denaturation. C. Theoretical models for the mechanism of denaturation. Adv Protein Chem. 1970;24:1–95. - PubMed
-
- Privalov PL. Stability of proteins: Small globular proteins. Adv Protein Chem. 1979;33:167–241. - PubMed
Publication types
MeSH terms
Substances
LinkOut - more resources
Full Text Sources
Other Literature Sources
Miscellaneous
