. 2009 Jul 28;106(30):12245-50.
doi: 10.1073/pnas.0813088106. Epub 2009 Jul 15.

Cell fate decision mediated by p53 pulses

Affiliations

Cell fate decision mediated by p53 pulses

Xiao-Peng Zhang et al. Proc Natl Acad Sci U S A. .

Abstract

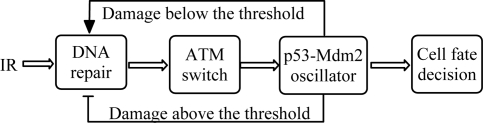
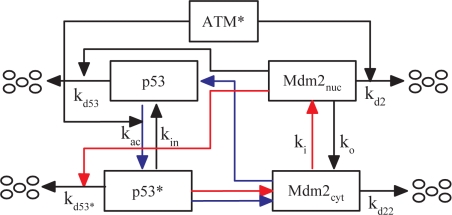
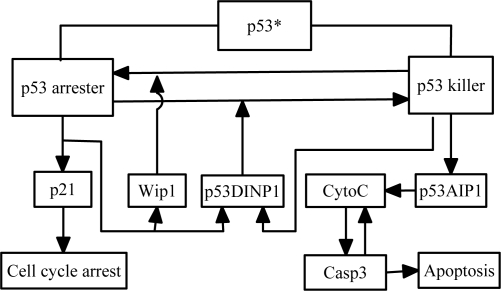
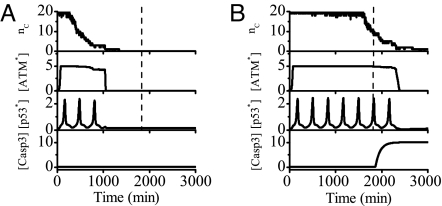
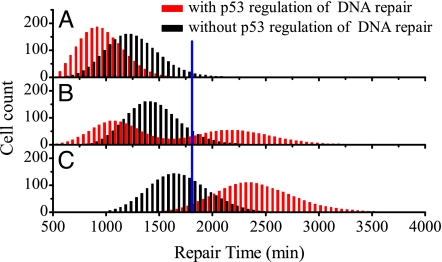
The tumor suppressor p53 plays a crucial role in cellular response to various stresses. Recent experiments have shown that p53 level exhibits a series of pulses after DNA damage caused by ionizing radiation (IR). However, how the p53 pulses govern cell survival and death remains unclear. Here, we develop an integrated model with four modules for the p53 network and explore the mechanism for cell fate decision based on the dynamics of the network. By numerical simulations, the following processes are characterized. First, DNA repair proteins bind to IR-induced double-strand breaks, forming complexes, which are then detected by ataxia telangiectasia mutated (ATM). Activated ATM initiates the p53 oscillator to produce pulses. Consequently, the target genes of p53 are selectively induced to control cell fate. We propose that p53 promotes the repair of minor DNA damage but suppresses the repair of severe damage. We demonstrate that cell fate is determined by the number of p53 pulses relying on the extent of DNA damage. At low damage levels, few p53 pulses evoke cell cycle arrest by inducing p21 and promote cell survival, whereas at high damage levels, sustained p53 pulses trigger apoptosis by inducing p53AIP1. We find that p53 can effectively maintain genomic integrity by regulating the efficiency and fidelity of DNA repair. We also show that stochasticity in the generation and repair of DNA damage leads to variability in cell fate. These findings are consistent with experimental observations and advance our understanding of the dynamics and functions of the p53 network.


Conflict of interest statement

The authors declare no conflict of interest.

Figures

Fig. 1.
Fig. 1.
An integrated model of p53 signaling network. There are four modules: a DNA repair module, an ATM switch, the p53–Mdm2 oscillator, and a cell fate decision module. The p53 regulation of DNA repair is threshold-dependent and is denoted as feedback from the p53–Mdm2 oscillator to the DNA repair module.
Fig. 2.
Fig. 2.
Model of the p53–Mdm2 oscillator. Two forms of p53 in the nucleus are considered, inactive p53 and active p53*. Mdm2 in the nucleus and cytoplasm is denoted as Mdm2nuc and Mdm2cyt, respectively. They can shuttle between the two compartments at rates ki and ko. Inactive p53 is degraded rapidly by Mdm2 at a rate kd53, whereas active p53* is degraded slowly at a rate kd53* because of its weak binding affinity to Mdm2nuc. Combined negative (red lines) and positive (blue lines) feedback loops are responsible for p53 oscillations. In the negative-feedback loop, p53* promotes production of Mdm2cyt, which then enters the nucleus to induce degradation of p53*. In the positive-feedback loop, p53* induces Mdm2 to synthesize Mdm2cyt, which promotes the translation of p53 mRNA to produce inactive p53.
Fig. 3.
Fig. 3.
Model of cell fate decision. There are two forms of active p53: p53 arrester and p53 killer. p53 arrester regulates the expression of Wip1, p53DINP1, and p21, whereas p53 killer controls the expression of p53DINP1 and p53AIP1. CytoC and Casp3 are the pro-apoptotic components. There is a positive-feedback loop between CytoC and Casp3, which creates an apoptotic switch. The release of CytoC leads to activation of Casp3, which in turn cleaves the inhibitors of p53AIP1 (such as Bcl-2 and Bcl-xL) to enhance the release of CytoC.
Fig. 4.
Fig. 4.
Overview of signal transduction in the p53 network. Shown are time courses of the output of each module at the IR dose of 3 Gy (A) or 5 Gy (B). Upon IR, a number of DSBCs, nC, are produced and then ATM is activated, initiating the p53 oscillations. When DNA damage is effectively repaired, the ATM switch is turned off and the concentration of p53* returns to a low level. At low IR doses, few p53 pulses cannot activate Casp3 and the cell recovers to normal growth. At high doses, sustained p53 pulses lead to activation of Casp3 and apoptosis ensues. The dashed lines denote a threshold time for cell fate decision.
Fig. 5.
Fig. 5.
Histograms of repair time. The cell count vs. the repair time is plotted for a population of 2,000 cells with and without p53 regulation (red and black lines, respectively) at the IR dose of 4 Gy (A), 5 Gy (B), or 6 Gy (C). The blue line denotes the threshold time for cell fate decision. With p53 regulation, the repair process depends on the levels of p53 and DNA damage, i.e., p53 promotes the repair of minor damage but suppresses the repair of severe damage. A threshold of 175 DSBs is set to distinguish between low and high damage levels.
Fig. 6.
Fig. 6.
Switching behavior of ATM. (A) Bifurcation diagram of ATM* level vs. the number of DSBCs, nC. The ATM switch turns on if nC > 4 (the upward arrow) or turns off if nC < 3 (downward arrow). (B) Time courses of ATM* level for 3 individual cells at DIR = 5 Gy. The ATM switch is on during the DSB repair process and is off only after DSBs are effectively repaired.
Fig. 7.
Fig. 7.
p53 pulses. (A) Bifurcation diagram of p53* level vs. ATM* level. In unstressed cells, ATM is inactive and p53 remains in a low-level steady state (solid line). Upon IR, the steady state becomes unstable (black dashed line), and p53* level undergoes oscillations between the maxima and minima of the limit cycle (red dashed lines) when ATM level is in the region marked by the bidirectional arrows. (B) Time course of the levels of p53 (black), p53* (red), Mdm2cyt (blue), and Mdm2nuc (green) over one period. (C) A series of p53 pulses for three individual cells at DIR = 5 Gy. The blue line denotes the threshold time for cell fate decision (compare Fig. 4). (D) Fraction of cells with different numbers of pulses at IR doses of 1 Gy (black), 3 Gy (red), 5 Gy (blue), and 6 Gy (green). The pink line denotes the critical pulse number for cell fate decision. (E) The mean nP vs. DIR without the effect of apoptosis. (F) The mean nP vs. DIR with the effect of apoptosis. Here the mean number is obtained by averaging over 2,000 cells, and the error bars indicate the standard deviation.
Fig. 8.
Fig. 8.
p53-induced cell cycle arrest and apoptosis. (A) Time courses of the levels of p53 arrester and p53 killer (Left), p21 (Center), and Casp3 (Right) for 3 cells at the IR dose of 5 Gy. In Left, the blue line denotes the threshold time for cell fate decision and the black and red pulses represent p53 arrester and p53 killer, respectively. There exists remarkable variability in p53 dynamics and cell fate. (B) Fraction of apoptotic cells within a 2,000 cell population, FA, vs. DIR for the cases with (circles) and without (squares) p53 regulation of DNA repair.

References

    1. Vousden KH, Lane DP. p53 in health and disease. Nat Rev Mol Cell Biol. 2007;8:275–283. - PubMed
    1. Harris SL, Levine AJ. The p53 pathway: positive and negative feedback loops. Oncogene. 2005;24:2899–2908. - PubMed
    1. Lev Bar-Or R, et al. Generation of oscillations by the p53-Mdm2 feedback loop: A theoretical and experimental study. Proc Natl Acad Sci USA. 2000;97:11250–11255. - PMC - PubMed
    1. Hu W, et al. A single nucleotide polymorphism in the Mdm2 gene disrupts the oscillation of p53 and Mdm2 levels in cells. Cancer Res. 2007;67:2757–2765. - PubMed
    1. Ramalingam S, et al. Quantitative assessment of the p53-Mdm2 feedback loop using protein lysate microarrays. Cancer Res. 2007;67:6247–6252. - PubMed

Publication types

MeSH terms