. 2009 Jul 21;106(29):11960-5.
doi: 10.1073/pnas.0904875106. Epub 2009 Jul 15.

A hyperfused mitochondrial state achieved at G1-S regulates cyclin E buildup and entry into S phase

Affiliations

A hyperfused mitochondrial state achieved at G1-S regulates cyclin E buildup and entry into S phase

Kasturi Mitra et al. Proc Natl Acad Sci U S A. .

Abstract

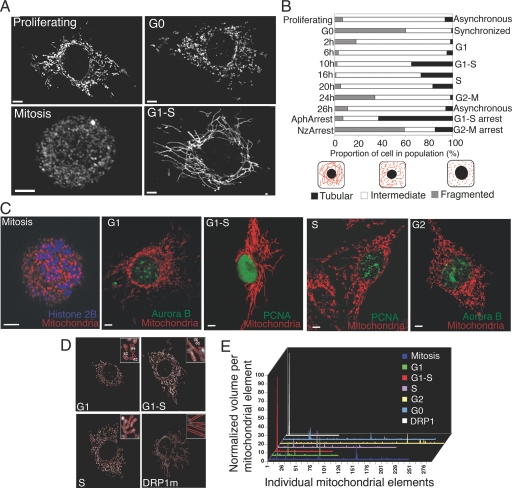
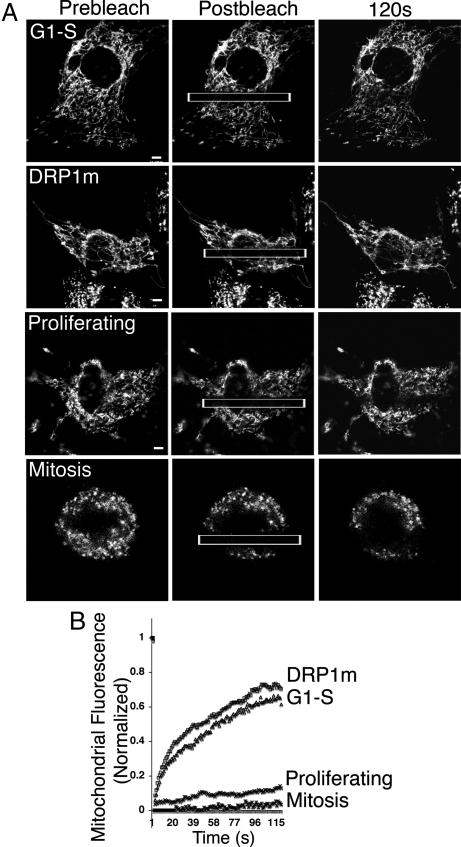
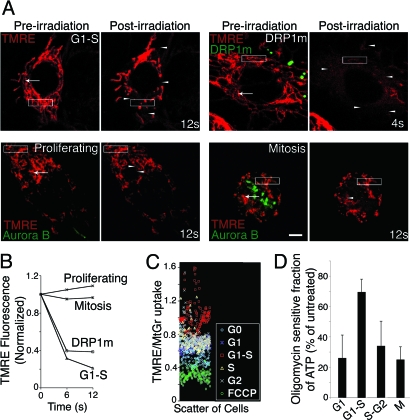
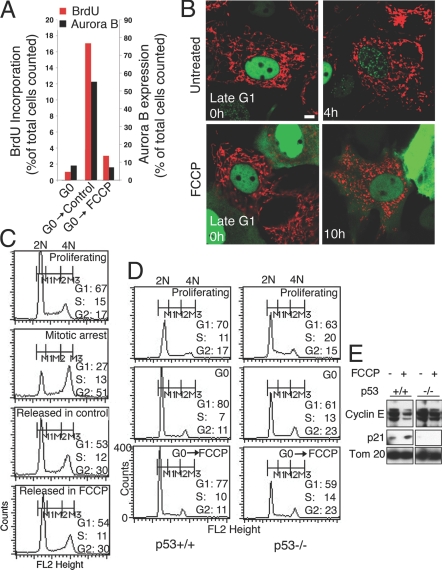
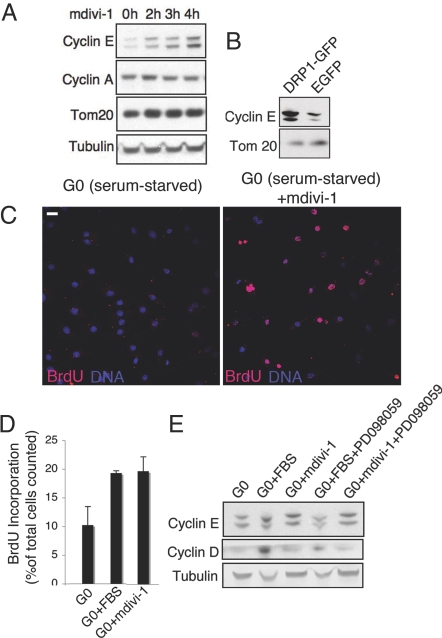
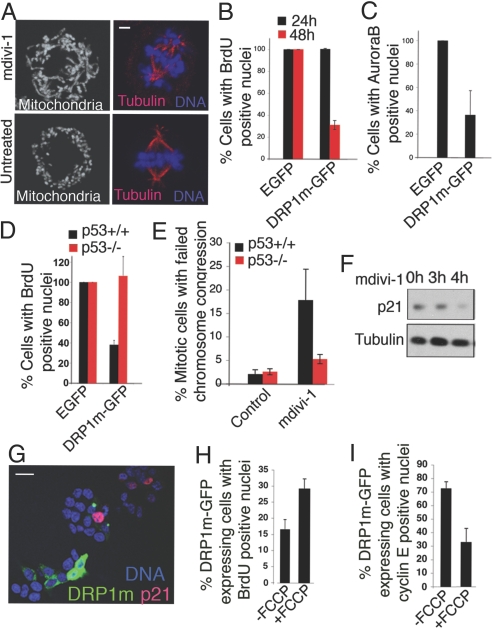
Mitochondria undergo fission-fusion events that render these organelles highly dynamic in cells. We report a relationship between mitochondrial form and cell cycle control at the G(1)-S boundary. Mitochondria convert from isolated, fragmented elements into a hyperfused, giant network at G(1)-S transition. The network is electrically continuous and has greater ATP output than mitochondria at any other cell cycle stage. Depolarizing mitochondria at early G(1) to prevent these changes causes cell cycle progression into S phase to be blocked. Inducing mitochondrial hyperfusion by acute inhibition of dynamin-related protein-1 (DRP1) causes quiescent cells maintained without growth factors to begin replicating their DNA and coincides with buildup of cyclin E, the cyclin responsible for G(1)-to-S phase progression. Prolonged or untimely formation of hyperfused mitochondria, through chronic inhibition of DRP1, causes defects in mitotic chromosome alignment and S-phase entry characteristic of cyclin E overexpression. These findings suggest a hyperfused mitochondrial system with specialized properties at G(1)-S is linked to cyclin E buildup for regulation of G(1)-to-S progression.


Conflict of interest statement

The authors declare no conflict of interest.

Figures

Fig. 1.
Fig. 1.
Formation of a giant mitochondrial network during G1-to-S transition. (A) 3D projection images of mito-NRK cells showing mitochondrial distribution in proliferating cells or cells arrested at different cell cycle stages. (B) Mitochondrial morphology in a cell population released from G0 into the cell cycle. At each time point, mitochondria in ≈250 cells were visually scored as tubular, fragmented, or intermediate, as in the diagram. Mitochondria in cells in G1–S and G2–M were also scored. (C) Images of mitochondria in live mito-NRK cells transfected with fluorescent protein-tagged versions of cell cycle-specific markers to identify different cell cycle stages (SI Methods). (Scale bars: 5 μm.) (D) Representative images for morphometric analysis of mitochondrial morphology in cells synchronized at different cell cycle stages or after expression of DRP1m-GFP. Individual mitochondria are bounded in red and numbered. (E) Plot of the volume of individual mitochondrial elements within individual cells. Morphometric information obtained from D was used after normalization with total mitochondrial volume within the cell.
Fig. 2.
Fig. 2.
Mitochondria in cells at G1–S or in cells expressing DRP1m-expressing cells have a continuous matrix. (A) FRAP analysis for assaying mitochondrial matrix continuity in mito-NRK cells at different cell cycle stages or expressing DRP1m. Mitochondrial fluorescence was bleached in the rectangular box, and recovery of fluorescence into the bleached region from adjacent mitochondrial elements was monitored. Images at the prebleach, postbleach, and 120-s recovery point are shown. (B) Plot of recovery kinetics from the FRAP experiment shown in A. Comparable results were obtained from 3 or 4 separate experiments. (Scale bar: 5 μm.)
Fig. 3.
Fig. 3.
The giant tubular mitochondrial form at G1–S is electrically continuous and associated with increased membrane potential and elevated ATP production. (A) Microirradiation of TMRE-loaded mitochondria to measure electrical continuity of mitochondria by rapid spread of depolarization from an irradiated point (see Results). (Scale bar: 5 μm.) (B) Plot for loss of TMRE fluorescence during the microirradiation experiment. Fluorescence associated with the rectangular boxes in A before and after irradiation is plotted in each cell condition. Comparable results were obtained from 3 to 4 separate experiments. (C) Scatter plot of mitochondrial TMRE/MitoTracker Green uptake in individual cells from populations enriched in different stages of the cell cycle or in cells treated with FCCP (10 μM, 16 h) after 6 h of release from G0. Data points are color-coded according to their cell cycle stage. A total of 50 cells was counted for each condition in 3 independent experiments. (D) Contribution of mitochondrial ATP at different stages of cell cycle. At each stage, samples were treated with or without oligomycin (10 μg/mL for 4 h), and the absolute difference between the treated and untreated ATP values was then expressed as the percentage of the untreated value. Data derived from the average of 3 experiments are shown with the bars showing the standard deviation.
Fig. 4.
Fig. 4.
Depolarization of mitochondria causes a specific block in G1-to-S transition in a p53–p21-dependent manner. (A) Effect of FCCP on BrdU incorporation and Aurora B expression in a cell population at G0 (G0), or released from G0 for 6 h and maintained with or without in FCCP (10 μM) for 18 h (G0→control; G0→FCCP). The effect was measured in approximately ≈400 cells per condition. (B) Time-lapse images of mito-NRK cells expressing PCNA-GFP to detect G1-to-S progression in cells treated with or without FCCP. (Scale bar: 5 μm.) (C) FACS analysis of DNA content of NRK cells arrested in/before mitosis, and subsequently shifted into control medium with or without FCCP. Markers are M1 for G1; M2 for S phase; and M3 for G2; numbers represent the proportion of cells in these stages. (D) FACS analysis of DNA content in HCT116 cells (p53+/+ and p53−/−) on treatment with FCCP. Proliferating cells were arrested in G0 and then released in the presence of FCCP (10 μM, 18 h) (G0→FCCP). Numbers denote percentage of cells in G1, G2, and S. (E) Immunoblot analysis showing FCCP's effect on cyclin E and p21 levels, and its relationship to p53. Proliferating HCT116 cells (p53+/+ or p53−/−) were treated with FCCP for 18 h, and cell lysates were immunoblotted with relevant antibodies. Tom20 served as the loading control. Comparable results were obtained from 3 to 4 separate experiments.
Fig. 5.
Fig. 5.
A hyperfused mitochondrial form leads to G0-to-S transition by increasing cyclin E levels independent of growth factors. (A) Immunoblot analysis for cyclin E and cyclin A during treatment with mdivi-1. Proliferating HCT116 cells were treated with mdivi-1 (50 μM) for the indicated times, and cell extracts were immunoblotted with the indicated antibodies. Tom20 and Tubulin served as controls. (B) Immunoblot analysis of cyclin E in NRK cells overexpressing DRP1m or EGFP. Tom20 served as loading control. (C) Immunofluorescence showing BrdU incorporation after treatment of cells in G0 with mdivi-1. NRK cells at G0 (serum starved) were treated with mdivi-1 (50 μM, 4 h) and assessed for BrdU incorporation (see Methods). (Scale bar: 20 μm.) (D) Quantification of BrdU incorporation induced by mdivi-1 treatment compared with that by serum treatment in HCT116 cells maintained at G0 (serum starved). BrdU incorporation was quantified in G0 (G0) cells treated with 10% FBS (G0+FBS) and in G0 cells treated with mdivi-1 (G0+mdivi-1). (E) Immunoblot analysis showing cyclin E induction by mdivi-1 treatment of G0 cells is independent of growth factor signaling. Analysis was performed by using HCT116 cells that were serum starved (G0); serum starved followed by addition of 10% FBS (G0+FBS); or serum starved followed by 50 μM mdivi-1 treatment for 4 h (G0+mdivi-1). Parallel G0 populations were first treated with PD098059 (50 μM, 45 min) before addition of FBS (G0+FBS+PD098059) or mdivi-1 (G0+mdivi-1+PD098059). Cell extracts were immunoblotted for cyclin E and cyclin D with tubulin serving as loading control.
Fig. 6.
Fig. 6.
Cell cycle defects by the untimely presence of hyperfused mitochondria. (A) Chromosomal defects in mitotic cells after mdivi-1 treatment. Proliferating HCT116 cells were treated/untreated with mdivi-1 (50 μM) for 4 h and stained with MitoTracker green (Left) or Hoechst (Right). Tubulin immunostaining (red) showing the mitotic spindle in Right. (Scale bar: 2 μm.) (B) Reduction in BrdU incorporation in cells expressing DRP1m-GFP. DRP1m-GFP or EGFP were overexpressed for 24 or 48 h in NRK cells, and the cells were then counted for BrdU incorporation. Also see Fig. S9A. (C) Decrease in nuclear Aurora B localization in cells expressing DRP1m-GFP (for 48 h). Also see Fig. S9B. In B and C, measurements were made from ≈150 cells in each of 3 independent experiments. Data were expressed as a percentage of BrdU/AuroraB-positive nuclei seen in cells expressing EGFP. (D) Effect of DRP1m-GFP expression on BrdU incorporation in p53+/+ versus p53−/− HCT116 cells as counted in ≈150 cells expressing DRP1m-GFP (for 48 h). Results are expressed as a percentage of that seen in cells similarly expressing EGFP alone. Also see Fig. S10C. (E) Percentage of cells with failed chromosome congression in metaphase (as in Fig. 6A) in mdivi-1-treated p53+/+ HCT116 versus p53−/− HCT116 cells. The phenotype was quantified in ≈300 mitotic cells in each of the 3 independent experiments. (F) mdivi-1 treatment does not induce p21. Proliferating HCT116 cells were treated with mdivi-1 for the indicated times and cell extracts immunoblotted for p21 or for tubulin as a loading control. (G) Lack of p21 expression in DRP1m-GFP-expressing cells on mdivi-1 treatment in HCT116, p53+/+ cells. More than 75% of the DRP1m-GFP-expressing cells were negative for p21. (Scale bar: 20 μm.) (H) Increase in BrdU incorporation in DRP1m-expressing cells (48 h) after FCCP treatment (10 μM, 3 h). Also see Fig. S10A. (I) Decrease in nuclear cyclin E in DRP1m-expressing cells (48 h) treated with FCCP (10 μM, 3 h). Also see Fig. S10B. Data in D and E were obtained from ≈150 cells expressing DRP1m-GFP in each of 3 different experiments. In all plots, bars represent standard deviation from 3 different experiments.

Comment in

References

    1. Detmer SA, Chan DC. Functions and dysfunctions of mitochondrial dynamics. Nat Rev Mol Cell Biol. 2007;8:870–879. - PubMed
    1. Karbowski M, Youle RJ. Dynamics of mitochondrial morphology in healthy cells and during apoptosis. Cell Death Differ. 2003;10:870–880. - PubMed
    1. Schieke SM, McCoy JP, Jr, Finkel T. Coordination of mitochondrial bioenergetics with G1 phase cell cycle progression. Cell Cycle. 2008;7:1782–1787. - PMC - PubMed
    1. Mandal S, Guptan P, Owusu-Ansah E, Banerjee U. Mitochondrial regulation of cell cycle progression during development as revealed by the tenured mutation in Drosophila. Dev Cell. 2005;9:843–854. - PubMed
    1. Matoba S, et al. p53 regulates mitochondrial respiration. Science. 2006;312:1650–1653. - PubMed

Publication types