. 2009 Jul 28;106(30):12530-5.
doi: 10.1073/pnas.0804273106. Epub 2009 Jul 15.

Gliomas induce and exploit microglial MT1-MMP expression for tumor expansion

Affiliations

Gliomas induce and exploit microglial MT1-MMP expression for tumor expansion

D S Markovic et al. Proc Natl Acad Sci U S A. .

Abstract

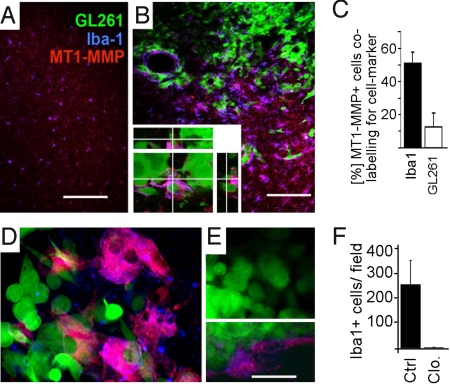
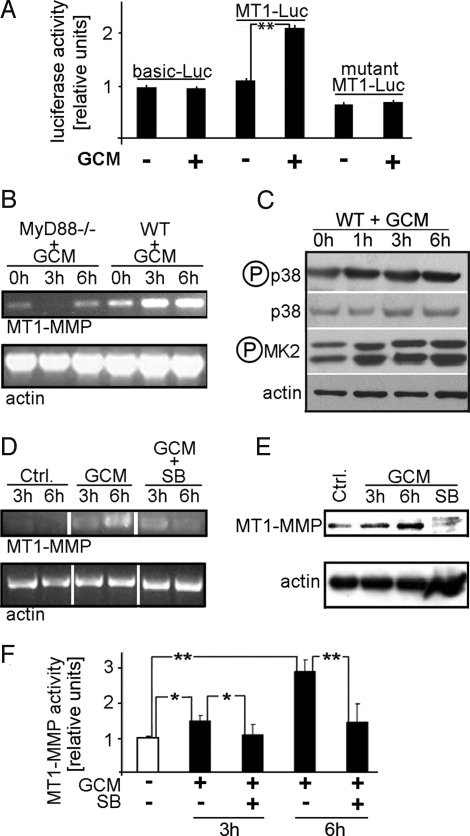
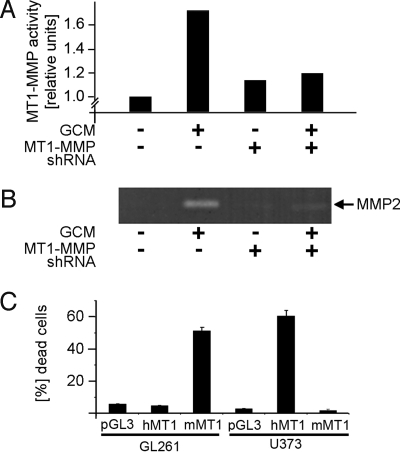
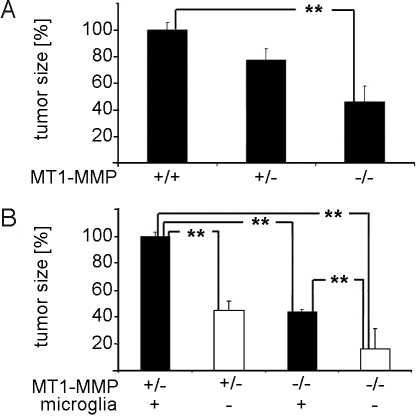
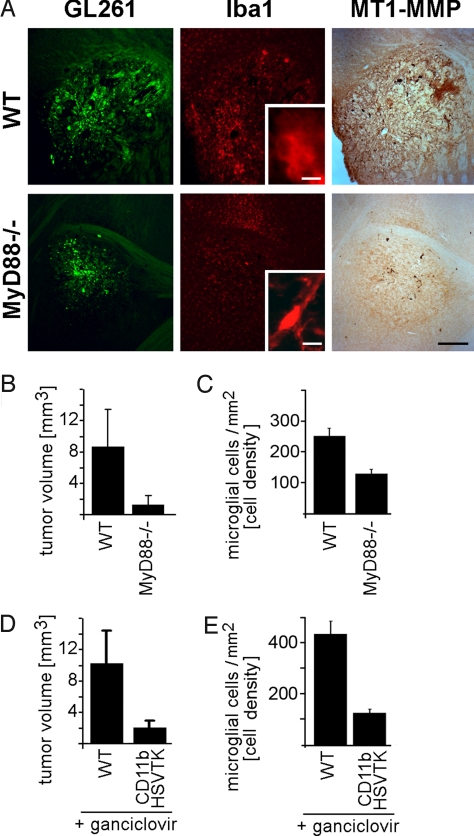
Diffuse infiltration of glioma cells into normal brain tissue is considered to be a main reason for the unfavorable outcomes of patients with malignant gliomas. Invasion of glioma cells into the brain parenchyma is facilitated by metalloprotease-mediated degradation of the extracellular matrix. Metalloproteases are released as inactive pro-forms and get activated upon cleavage by membrane bound metalloproteases. Here, we show that membrane type 1 metalloprotease (MT1-MMP) is up-regulated in glioma-associated microglia, but not in the glioma cells. Overexpression of MT1-MMP is even lethal for glioma cells. Glioma-released factors trigger the expression and activity of MT1-MMP via microglial toll-like receptors and the p38 MAPK pathway, as deletion of the toll-like receptor adapter protein MyD88 or p38 inhibition prevented MT1-MMP expression and activity in cultured microglial cells. Microglial MT1-MMP in turn activates glioma-derived pro-MMP-2 and promotes glioma expansion, as shown in an ex vivo model using MT1-MMP-deficient brain tissue and a microglia depletion paradigm. Finally, MyD88 deficiency or microglia depletion largely attenuated glioma expansion in 2 independent in vivo models.


Conflict of interest statement

The authors declare no conflict of interest.

Figures

Fig. 1.
Fig. 1.
Iba1-positive cells are overexpressing MT1-MMP when associated with experimental gliomas. Mouse brains injected with GL261 glioma cells expressing EGFP (green) were studied for the microglia marker Iba1 (blue) and for the metalloprotease MT1-MMP (red). (A) In the control (i.e., non-injected) hemisphere, the level of MT1-MMP expression is low. (B) The density of microglial cells is much higher in the vicinity of gliomas than in normal brain. MT1-MMP is expressed in microglia associated with glioma. Labeling for MT1-MMP is especially intense in microglia making close contact with glioma cells, whereas GL261 glioma cells express only very low levels of MT1-MMP. A magnified 3D reconstructed micrograph of the tumor area is shown (Inset). (C) Quantification of MT1-MMP expression in microglia and glioma. (D) GFP-expressing glioma cells 5 d after injection into cultivated brain slices shows again that MT1-MMP (blue) is expressed on microglia and endothelia (labeled by isolectin-B4; red). (E) A microglia-depleted brain slice preparation 5 d after injection of GFP-expressing glioma cells was labeled as in D; note that there is no labeling for microglia, whereas labeling for endothelial cells is still present (Inset, E). (F) Quantification of labeling for Iba1 in cultivated brain slices treated with clodronate (Clo.; for microglia depletion) compared with control slices (Ctrl.; i.e., microglia are intact). (Scale bars: 150 μm in A and B, 75 μm and 35 μm in D and E.)
Fig. 2.
Fig. 2.
A glioma-released factor induces microglial MT1-MMP expression and activity via TLR signaling and the p38 MAPK pathway. (A). MT1-MMP gene expression in microglia stimulated with GCM was measured with a MT1-MMP promoter assay, using constructs containing the full MT1-MMP promoter (MT1-Luc), a promoter-free construct (pGL3-Basic) and a promoter construct containing a mutated MT1-MMP promoter (MT1-Luc-mut). GCM treatment induced the activity of the MT1-MMP promoter to approximately 210%. (B) RT-PCR for MT1-MMP expressed in microglia from WT or MyD88-knockout mice (MyD88-/-), stimulated with GCM for 0, 3, and 6 h (actin serves as loading control); note that MyD88 deficiency prevented the MT1-MMP up-regulation seen in WT. (C) Activation of the p38 MAPK pathway was observed in primary microglia treated for a maximum of 6 h with GCM. The cell lysates were analyzed for activated (i.e., phosphorylated) p38 MAPK (p-p38) and total p38 MAPK (p38). The membranes were then re-probed with anti-phosho-MAPKAPK-2 (p-MK2) antibodies, showing the activation of p38 MAPK downstream kinase (MK2; actin serves as loading control). (D) RT-PCR analysis highlights the p38 dependence of MT1-MMP expression; MT1-MMP mRNA levels (and actin as control) in microglia after stimulation with GCM or with GCM containing SB202190 (GCM+SB). (E) Western blots of microglial protein extracts upon stimulation with GCM or GCM+SB202190; note that GCM induced and co-treatment with SB 202190 prevented expression of MT1-MMP. (F) MT1-MMP activity increase after GCM treatment is mediated by p38 MAPK. Microglial cultures were stimulated with GCM or with GCM containing SB202190 for indicated time periods. The activity is normalized to controls (i.e., the baseline activity was measured in non-stimulated microglia). *Significant at P < 0.05. **Significant at P < 0.01.
Fig. 3.
Fig. 3.
Microglial MT1-MMP activation of glioma-derived MMP-2 and the impact of glioma MT1-MMP expression on cell survival. (A) MT1-MMP shRNA blocks the GCM-stimulated MT1-MMP activity in microglia. The activity is measured with an enzymatic assay and is normalized to controls (i.e., the baseline activity was measured in non-stimulated microglia). (B) The gelatin zymography demonstrates that activation of MMP-2 is diminished in microglia transfected with an shRNA for MT1-MMP. (C) Forced expression of MT1-MMP in glioma cells induces cell death. The GL261 (mouse) and U373 (human) glioma cells were transfected with empty vector-pGL3, human MT1-MMP vector (hMT1), or mouse MT1-MMP vector (mMT1). Forty-eight hours after transfection, the cells were stained with propidium iodide (which labels dead cells) and Hoechst dye (which labels all cells). The rate of cell death was expressed as percentage of total cells.
Fig. 4.
Fig. 4.
Microglial MT1-MMP mediates increased tumor size. (A) Invasion of glioma cells within organotypic brain slice cultures was determined from MT1-MMP WT (MT1-MMP+/+), MT1-MMP heterozygous (MT1-MMP+/−), and knockout (MT1-MMP−/−) mice 5 d after tumor injection. It is evident that the tumor invasion promoting MT1-MMP activity stems from the parenchyma. Defining the tumor size in organotypic brain slice cultures from MT1-MMP+/+ as 100%, the average tumor size from MT1-MMP−/− mice was 46% and that from MT1-MMP+/+ was 57.5%. (B) The tumor size from MT1-MMP+/− mice was defined as 100% and microglia depletion resulted in a tumor size of 45%. Tumor size of control and microglia-depleted organotypic brain slice cultures containing from MT1-MMP−/− mice was 43% and 16%, respectively. Significance was accessed by Wilcoxon signed-rank test; **P < 0.01.
Fig. 5.
Fig. 5.
Glioma-induced TLR signaling in microglia promotes parenchymal MT1-MMP expression and tumor expansion in vivo. Mice with reduced TLR-signaling (MyD88-/-; n = 8) and WT controls (n = 8) were intracerebrally inoculated with GFP-expressing glioma cells (GL261, green) and, 14 d later, immunohistochemically analyzed for Iba1 (red) MT1-MMP (brown DAB precipitate) staining (A); note that tumor size, intra- and peri-tumoral microglia density, and labeling intensity for MT1-MMP are all reduced in MyD88-/- animals; tumor volume (B) and microglia density (C) in and around glioma from MyD88-/- and WT were also quantified by stereology. Glioma cells were injected into the brain of transgenic CD11b-HSVTK (n = 8) and WT (n = 8) mice with subsequent intratumoral microglia depletion by intracerebral ganciclovir infusion in transgenic mice. Tumor volume (D) and intra- as well as peri-tumoral microglia density (E) were quantified by a morphometric stereologic analysis; note the significant microglia depletion and reduced tumor size. (Scale bar: 500 μm in A, 10 μm in A Insets.)

Similar articles

Cited by

References

    1. Osenkowski P, Toth M, Fridman R. Processing, shedding, and endocytosis of membrane type 1-matrix metalloproteinase (MT1-MMP) J Cell Physiol. 2004;200:2–10. - PubMed
    1. Mayes DA, et al. PAX6 suppresses the invasiveness of glioblastoma cells and the expression of the matrix metalloproteinase-2 gene. Cancer Res. 2006;66:9809–9817. - PubMed
    1. Guo P, et al. Up-regulation of angiopoietin-2, matrix metalloprotease-2, membrane type 1 metalloprotease, and laminin 5 gamma 2 correlates with the invasiveness of human glioma. Am J Pathol. 2005;166:877–890. - PMC - PubMed
    1. Rao JS. Molecular mechanisms of glioma invasiveness: the role of proteases. Nat Rev Cancer. 2003;3:489–501. - PubMed
    1. Olson JK, Miller SD. Microglia initiate central nervous system innate and adaptive immune responses through multiple TLRs. J Immunol. 2004;173:3916–3924. - PubMed

Publication types

MeSH terms

LinkOut - more resources