

Transcriptome of embryonic and neonatal mouse cortex by high-throughput RNA sequencing
- PMID: 19617558
- PMCID: PMC2722358
- DOI: 10.1073/pnas.0902417106
Transcriptome of embryonic and neonatal mouse cortex by high-throughput RNA sequencing
Abstract
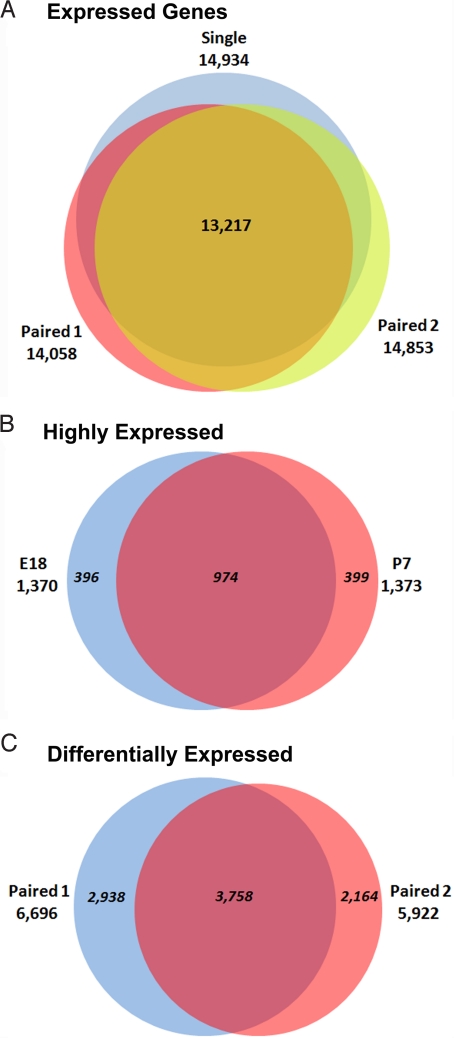
Brain structure and function experience dramatic changes from embryonic to postnatal development. Microarray analyses have detected differential gene expression at different stages and in disease models, but gene expression information during early brain development is limited. We have generated >27 million reads to identify mRNAs from the mouse cortex for >16,000 genes at either embryonic day 18 (E18) or postnatal day 7 (P7), a period of significant synaptogenesis for neural circuit formation. In addition, we devised strategies to detect alternative splice forms and uncovered more splice variants. We observed differential expression of 3,758 genes between the 2 stages, many with known functions or predicted to be important for neural development. Neurogenesis-related genes, such as those encoding Sox4, Sox11, and zinc-finger proteins, were more highly expressed at E18 than at P7. In contrast, the genes encoding synaptic proteins such as synaptotagmin, complexin 2, and syntaxin were up-regulated from E18 to P7. We also found that several neurological disorder-related genes were highly expressed at E18. Our transcriptome analysis may serve as a blueprint for gene expression pattern and provide functional clues of previously unknown genes and disease-related genes during early brain development.
Conflict of interest statement
The authors declare no conflict of interest.
Figures
References
-
- Allendoerfer KL, Shatz CJ. The subplate, a transient neocortical structure: Its role in the development of connections between thalamus and cortex. Annu Rev Neurosci. 1994;17:185–218. - PubMed
-
- Rakic P. A century of progress in corticoneurogenesis: From silver impregnation to genetic engineering. Cereb Cortex. 2006;16(Suppl 1):i3–17. - PubMed
-
- Christopherson KS, et al. Thrombospondins are astrocyte-secreted proteins that promote CNS synaptogenesis. Cell. 2005;120:421–433. - PubMed
-
- Ullian EM, Christopherson KS, Barres BA. Role for glia in synaptogenesis. Glia. 2004;47:209–216. - PubMed
-
- Matsuo I, Kuratani S, Kimura C, Takeda N, Aizawa S. Mouse Otx2 functions in the formation and patterning of rostral head. Genes Dev. 1995;9:2646–2658. - PubMed
Publication types
MeSH terms
Substances
Grants and funding
LinkOut - more resources
Full Text Sources
Other Literature Sources
Molecular Biology Databases
