. 2009;4(8):1184-91.
doi: 10.1038/nprot.2009.97. Epub 2009 Jul 23.

Mapping identifiers for the integration of genomic datasets with the R/Bioconductor package biomaRt

Affiliations

Mapping identifiers for the integration of genomic datasets with the R/Bioconductor package biomaRt

Steffen Durinck et al. Nat Protoc. 2009.

Abstract

Genomic experiments produce multiple views of biological systems, among them are DNA sequence and copy number variation, and mRNA and protein abundance. Understanding these systems needs integrated bioinformatic analysis. Public databases such as Ensembl provide relationships and mappings between the relevant sets of probe and target molecules. However, the relationships can be biologically complex and the content of the databases is dynamic. We demonstrate how to use the computational environment R to integrate and jointly analyze experimental datasets, employing BioMart web services to provide the molecule mappings. We also discuss typical problems that are encountered in making gene-to-transcript-to-protein mappings. The approach provides a flexible, programmable and reproducible basis for state-of-the-art bioinformatic data integration.


Conflict of interest statement

COMPETING FINANCIAL INTERESTS

The authors declare that they have no competing financial interests.

Figures
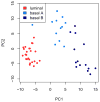
Figure 1
Figure 1
Principal component analysis using the mRNA profiles of the 200 most variable probesets. Note how the first principal component (PC1) clearly separates the luminal type (red) from the basal A (lightblue) and basal B (darkblue) types, between which the variation is more continuous.
Figure 2
Figure 2
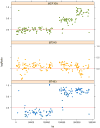
The CGH log-ratios of chromosome I for three cell lines (MCF10A, BT549 and BT483). Chromosomal coordinates vary along the x-axis. Note how MCF10A and BT483 have amplifications on the q-arm of the chromosome, which is the right hand half of the plot as the region with no values in the middle of each plot is the centromere.
Figure 3
Figure 3
Expression data of probes mapping to chromosome 1 for the two cell lines BT483 and BT549. The probesets mapping to the region amplified in BT483 (genomic coordinate > 140 MB) are shown by red dots, the other probesets in grey. The expression difference is significant with a t-test p-value of 2.2e-16.
Figure 4
Figure 4
Barplot showing the maximum protein expression levels over all cell lines for each of the quantified proteins.
Figure 5
Figure 5
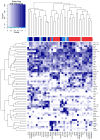
Heatmap showing a hierarchical clustering of the proteins (down right hand side) and samples (along the bottom) based on the protein expression measurements. A colour sidebar for the samples indicates to which cancer type the cell line belongs: basal A (blue), basal B (darkblue), luminal (red) and unknown (grey). The inset key shows on the x-axis the color scale of the protein expression matrix, from white (normalized expression value of 0) to dark blue (normalized expression value of 1). On the y-axis is the histogram count of number of points in the heatmap that have the corresponding normalized protein expression value as indicated by the lightblue line.
Figure 6
Figure 6
Expression profiles of AURKA over the cell lines (along the x-axis) for mRNA (orange) and protein (green) levels. The correlation coefficient (ρ) between these profiles is 0.686.
Figure 7
Figure 7
Scatterplots of protein expression levels versus mRNA expression levels in four cell lines. Note that there is only a modest correlation between these two methods of gene expression measurements. Differences may be due to technical reasons as well as to regulation of mRNA translation.

References

    1. R Development Core Team. R: A Language and Environment for Statistical Computing. R Foundation for Statistical Computing; Vienna, Austria: 2008.
    1. Gentleman RC, et al. Bioconductor: open software development for computational biology and bioinformatics. Genome Biol. 2004;5(10):R80. - PMC - PubMed
    1. Kasprzyk A, et al. Ensmart: a generic system for fast and flexible access to biological data. Genome Res. 2004;14(1):160–169. - PMC - PubMed
    1. Hubbard TJ, et al. Ensembl 2009. Nucleic Acids Res. 2009;37(Database issue):D690–697. - PMC - PubMed
    1. Rogers A, et al. Wormbase 2007. Nucleic Acids Res. 2008;36(Database issue):D612–617. - PMC - PubMed

Publication types