. 2009;4(8):1192-201.
doi: 10.1038/nprot.2009.100. Epub 2009 Jul 23.

Long term non-invasive imaging of embryonic stem cells using reporter genes

Affiliations

Long term non-invasive imaging of embryonic stem cells using reporter genes

Ning Sun et al. Nat Protoc. 2009.

Abstract

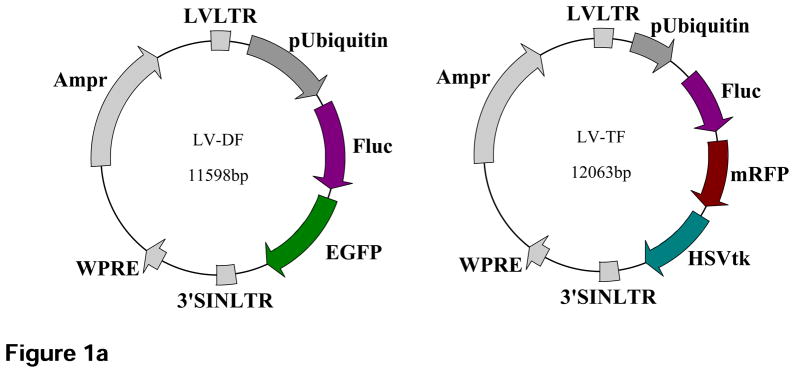
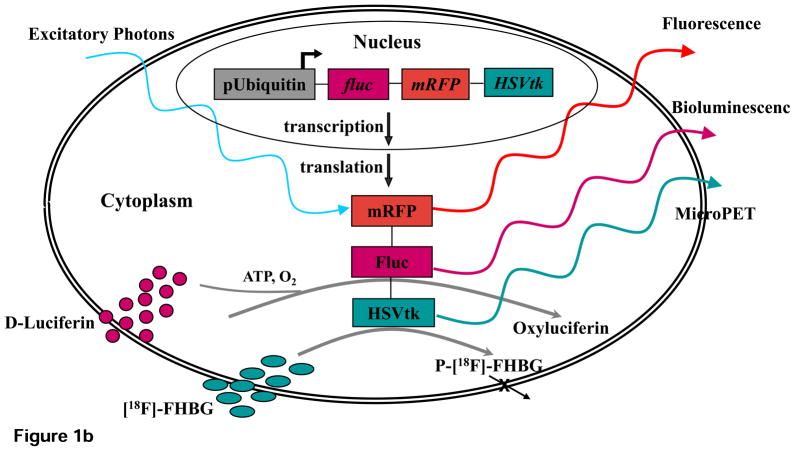
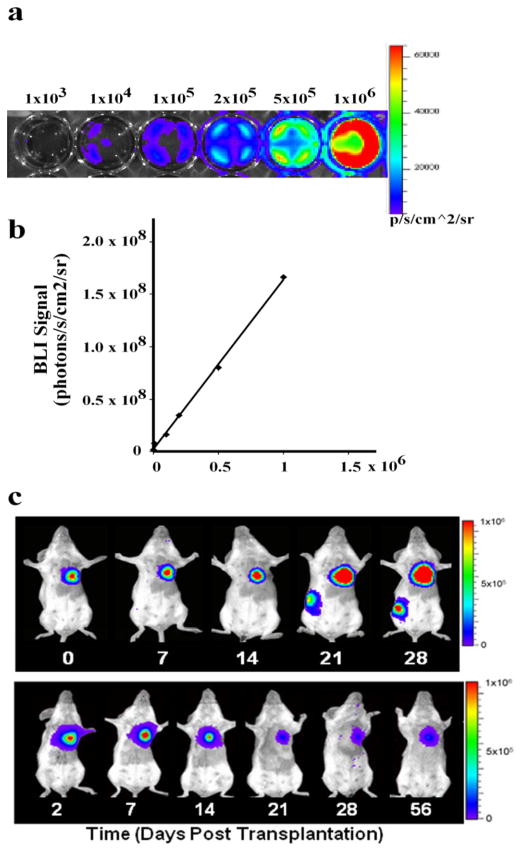
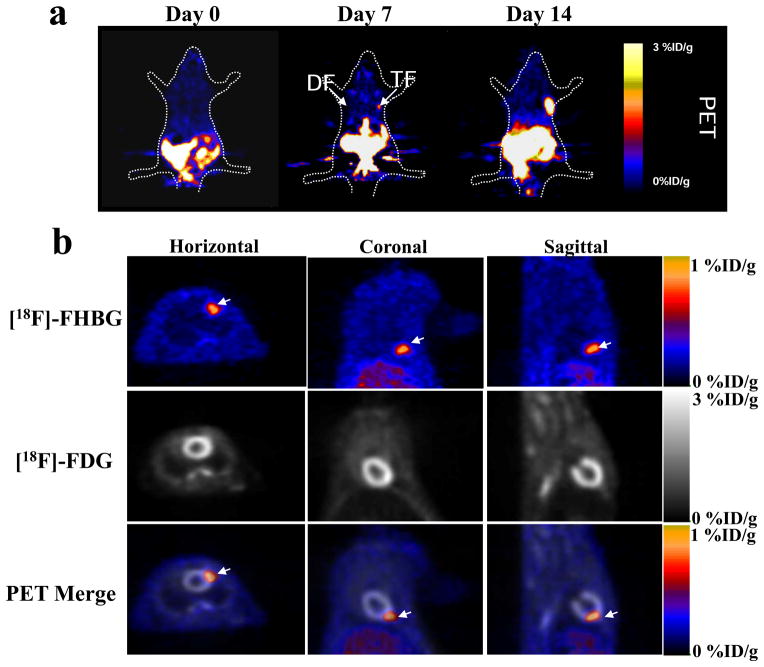
Development of non-invasive and accurate methods to track cell fate after delivery will greatly expedite transition of embryonic stem (ES) cell therapy to the clinic. In this protocol, we describe the in vivo monitoring of stem cell survival, proliferation and migration using reporter genes. We established stable ES cell lines constitutively expressing double fusion (DF; enhanced green fluorescent protein and firefly luciferase) or triple fusion (TF; monomeric red fluorescent protein, firefly luciferase and herpes simplex virus thymidine kinase (HSVtk)) reporter genes using lentiviral transduction. We used fluorescence-activated cell sorting to purify these populations in vitro, bioluminescence imaging and positron emission tomography (PET) imaging to track them in vivo and fluorescence immunostaining to confirm the results ex vivo. Unlike other methods of cell tracking, such as iron particle and radionuclide labeling, reporter genes are inherited genetically and can be used to monitor cell proliferation and survival for the lifetime of transplanted cells and their progeny.


Conflict of interest statement

Competing financial interests

The authors declare that they have no competing financial interests.

Figures

Figure 1
Figure 1
Schematic diagram of the DF and TF lentiviral constructs as well as the underlying mechanism of each imaging modality. (a) The DF construct contains enhanced green fluorescent protein (eGFP) and firefly luciferase (Fluc) reporter genes linked by 5 amino acid linker (GSHGD). The TF construct contains monomeric red fluorescent protein (mRFP), Fluc, and herpes simplex virus thymidine kinase (HSVtk) reporter genes, with the 3 fusion proteins joined by a 14-amino acid (LENSHASAGYQAST) and 8-amino acid (TAGPGSAT) linker, respectively. (b) Diagram illustrating the mechanism of each imaging modality based on their respective reporter genes using the TF construct as an example.
Figure 1
Figure 1
Schematic diagram of the DF and TF lentiviral constructs as well as the underlying mechanism of each imaging modality. (a) The DF construct contains enhanced green fluorescent protein (eGFP) and firefly luciferase (Fluc) reporter genes linked by 5 amino acid linker (GSHGD). The TF construct contains monomeric red fluorescent protein (mRFP), Fluc, and herpes simplex virus thymidine kinase (HSVtk) reporter genes, with the 3 fusion proteins joined by a 14-amino acid (LENSHASAGYQAST) and 8-amino acid (TAGPGSAT) linker, respectively. (b) Diagram illustrating the mechanism of each imaging modality based on their respective reporter genes using the TF construct as an example.
Figure 2
Figure 2
Comparison of physical labeling vs. reporter gene labeling for tracking fate of transplanted human ES cells and human ES cell-derived endothelial cells (hESC-ECs). (a) Approximately 1 × 10⁶ DF hES cells were co-labeled with iron particles and then transplanted into the right hind limb. An equal number of hESC-ECs were injected into the left hind limb. At day 28, bulky expansion of the left hind limb due to hES cell-derived teratoma formation (arrowhead) can be seen by MRI. (b) Quantitative analysis show relatively constant MRI signal activities for both hES cells and hESC-ECs over 4 weeks (signal activity is expressed as arbitrary units (AUs)). (c) BLI imaging of the same animal in (a). (d) Quantitative analysis of BLI signals (photons/second/cm2/steridin) from all animals transplanted with hES cells versus hESC-ECs. Note that the y-axis is shown as log 10 scale. (e) Staining for macrophages and iron 4 weeks after transplantation of hESC-ECs. Immunostaining of Mac-3 for macrophages (eI, eIII) and Prussian blue for iron (eII, eIV) was counterstained with hematoxylin and nuclear fast red, respectively. Note that macrophages loaded with iron particles could be found in between muscle bundles. Scale bars = 100 μm (eI, eIII) and 20 μm (eII, eIV). (f) Immunofluorescence staining of GFP for transplanted hESC-ECs, CD31 for microvasculature of hind limb, and Mac-3 for macrophages at 4 weeks after transplantation. No GFP+ hESC-ECs detected nearby the macrophages because of their poor survival after transplantation. Nuclei were stained with 4,6-diamidino-2-phenylindole (DAPI) (blue). Scale bar = 20 μm. Scale bar = 20 μm. Appropriate animal protocol has been approved by the Administrative Panel on Laboratory Animal Care of Stanford University. Data were reproduced with permission from ref. .
Figure 2
Figure 2
Comparison of physical labeling vs. reporter gene labeling for tracking fate of transplanted human ES cells and human ES cell-derived endothelial cells (hESC-ECs). (a) Approximately 1 × 10⁶ DF hES cells were co-labeled with iron particles and then transplanted into the right hind limb. An equal number of hESC-ECs were injected into the left hind limb. At day 28, bulky expansion of the left hind limb due to hES cell-derived teratoma formation (arrowhead) can be seen by MRI. (b) Quantitative analysis show relatively constant MRI signal activities for both hES cells and hESC-ECs over 4 weeks (signal activity is expressed as arbitrary units (AUs)). (c) BLI imaging of the same animal in (a). (d) Quantitative analysis of BLI signals (photons/second/cm2/steridin) from all animals transplanted with hES cells versus hESC-ECs. Note that the y-axis is shown as log 10 scale. (e) Staining for macrophages and iron 4 weeks after transplantation of hESC-ECs. Immunostaining of Mac-3 for macrophages (eI, eIII) and Prussian blue for iron (eII, eIV) was counterstained with hematoxylin and nuclear fast red, respectively. Note that macrophages loaded with iron particles could be found in between muscle bundles. Scale bars = 100 μm (eI, eIII) and 20 μm (eII, eIV). (f) Immunofluorescence staining of GFP for transplanted hESC-ECs, CD31 for microvasculature of hind limb, and Mac-3 for macrophages at 4 weeks after transplantation. No GFP+ hESC-ECs detected nearby the macrophages because of their poor survival after transplantation. Nuclei were stained with 4,6-diamidino-2-phenylindole (DAPI) (blue). Scale bar = 20 μm. Scale bar = 20 μm. Appropriate animal protocol has been approved by the Administrative Panel on Laboratory Animal Care of Stanford University. Data were reproduced with permission from ref. .
Figure 3
Figure 3
Bioluminescence imaging of transplanted ES cells. (a) Ex vivo BLI of undifferentiated DF human ES cells (H9 line). The numbers on top of the bioluminescence images indicate the number of cells seeded in the culture dish. Representative images from replicate experiments are shown. (b) Linear correlation of cell numbers and BLI signals (photons/second/cm2/steridin) in (a) (R2=0.99). (c) Tracking in vivo kinetics of transplanted DF hES cells and DF hES cell-derived cardiomyocytes with BLI. Representative images from a single animal receiving intramyocardial injection of 1×10⁶ undifferentiated DF hES cells (upper panel) or DF hES-derived cardiomyocytes (lower panel) are shown. Images were taken at the time point as indicated. Appropriate animal protocol has been approved by the Administrative Panel on Laboratory Animal Care of Stanford University. Data in c were reproduced with permission from ref. .
Figure 4
Figure 4
Small animal microPET imaging of transplanted ES cells. (a) One million mouse ES cells were transplanted into right shoulder (TF reporter gene) and left (DF reporter gene) shoulder of an adult nude mouse. The mouse was injected with ~150 μCi reporter probe [18F]-FHBG. PET imaging was performed 1 h after [18F]-FHBG injection and signals were expressed as [18F]-FHBG percentage injected dose per gram of tissue (%ID/g). (b) Small animal PET imaging of TF mouse ES cells two weeks after intramyocardial transplantation in nude rats. The TF mouse ES cells were imaged using [18F]-FHBG reporter probe and the myocardial viability was used using [18F]-fluoro-deoxyglucose ([18F]-FDG) radiotracer. The bottom row represents the merged [18F]-FHBG and [18F]-FDG images in horizontal, coronal, and sagittal views, which reflects the exact anatomic location of transplanted ES cells within the anterolateral wall of the heart (arrows). Appropriate animal protocol has been approved by the Administrative Panel on Laboratory Animal Care of Stanford University. Data in a and b were reproduced with permission from ref. and , respectively.

Similar articles

Cited by

References

    1. Thomson JA, et al. Embryonic stem cell lines derived from human blastocysts. Science. 1998;282:1145–1147. - PubMed
    1. Reinlib L, Field L. Cell transplantation as future therapy for cardiovascular disease?: A workshop of the National Heart, Lung, and Blood Institute. Circulation. 2000;101:E182–187. - PubMed
    1. Spergel DJ, Kruth U, Shimshek DR, Sprengel R, Seeburg PH. Using reporter genes to label selected neuronal populations in transgenic mice for gene promoter, anatomical, and physiological studies. Prog Neurobiol. 2001;63:673–686. - PubMed
    1. Blasberg RG, Tjuvajev JG. Molecular-genetic imaging: current and future perspectives. J Clin Invest. 2003;111:1620–1629. - PMC - PubMed
    1. Massoud TF, Gambhir SS. Molecular imaging in living subjects: seeing fundamental biological processes in a new light. Genes Dev. 2003;17:545–580. - PubMed

Publication types

Substances