. 2009 Oct 15;28(41):3597-607.
doi: 10.1038/onc.2009.217. Epub 2009 Jul 20.

Ect2 links the PKCiota-Par6alpha complex to Rac1 activation and cellular transformation

Affiliations

Ect2 links the PKCiota-Par6alpha complex to Rac1 activation and cellular transformation

V Justilien et al. Oncogene. .

Abstract

Protein kinase Ciota (PKCiota) promotes non-small cell lung cancer (NSCLC) by binding to Par6alpha and activating a Rac1-Pak-Mek1,2-Erk1,2 signaling cascade. The mechanism by which the PKCiota-Par6alpha complex regulates Rac1 is unknown. Here we show that epithelial cell transforming sequence 2 (Ect2), a guanine nucleotide exchange factor for Rho family GTPases, is coordinately amplified and overexpressed with PKCiota in NSCLC tumors. RNA interference-mediated knockdown of Ect2 inhibits Rac1 activity and blocks transformed growth, invasion and tumorigenicity of NSCLC cells. Expression of constitutively active Rac1 (RacV12) restores transformation to Ect2-deficient cells. Interestingly, the role of Ect2 in transformation is distinct from its well-established role in cytokinesis. In NSCLC cells, Ect2 is mislocalized to the cytoplasm where it binds the PKCiota-Par6alpha complex. RNA interference-mediated knockdown of either PKCiota or Par6alpha causes Ect2 to redistribute to the nucleus, indicating that the PKCiota-Par6alpha complex regulates the cytoplasmic localization of Ect2. Our data indicate that Ect2 and PKCiota are genetically and functionally linked in NSCLC, acting to coordinately drive tumor cell proliferation and invasion through formation of an oncogenic PKCiota-Par6alpha-Ect2 complex.


Figures

Figure 1
Figure 1. Ect2 and PKCι are coordinately amplified and over-expressed in primary NSCLC tumors
Ect2 is over-expressed in primary lung adenocarcinoma (LAC) and squamous cell carcinoma (LSCC) (A). 68 LAC cases, 69 LSCC cases and matched normal control lung tissues were analyzed by qPCR for Ect2 mRNA abundance. Ect2 mRNA is significantly higher in LAC and LSCC tumor samples than in matched normal lung (*p<0.0001 and p<0.0001 respectively). (B) ECT2 gene amplification drives Ect2 expression in LSCC. LSCC tumors were analyzed for ECT2 gene copy number as described in Materials and Methods. Tumors harboring ECT2 gene amplification express higher Ect2 mRNA than tumors without ECT2 amplification (*p< 0.001). (C) ECT2 and PRKCI are co-amplified in LSCC. ECT2 and PRKCI gene copy number exhibit a significant correlation in NSCLC tumors (N= 94; R2= 0.76; *p<0.00001). (D) Ect2 and PKCι mRNA are coordinately over-expressed in LSCC tumors harboring gene amplification (n=67; R2=0.52; *p<0.00001).
Figure 2
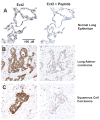
Figure 2. Ect2 is over-expressed and mis-localized to the cytoplasm in primary NSCLC tumors
Immunohistochemical localization of Ect2 in normal lung epithelium (A), lung adenocarcinoma (LAC) (B) and lung squamous cell carcinoma (LSCC) (C) was performed as described in Materials and Methods. Ect2 localizes predominantly to the nucleus of normal lung epithelial cells (A). Ect2 is over-expressed in both LAC (B) and LSCC (C) tumors and is mis-localized to the cytoplasm of tumor cells. Ect2 staining specificity was confirmed using an excess of Ect2 peptide in the antibody solution (A-C, Ect2 + peptide).
Figure 3
Figure 3. Ect2 is important for anchorage-independent growth and invasion of NSCLC cells
H1703 cells were infected with one of three recombinant lentiviruses containing RNAi targeting Ect2 (Ect2-RNAi #1-3) or a non-target (NT) sequence. Cell populations stably transduced with each RNAi were isolated and analyzed as described in Materials and Methods. (A) Cells expressing Ect2-RNAi or NT-RNAi constructs were assessed for Ect2 mRNA abundance by qPCR and Ect2 protein by immunoblot analysis. Cells expressing Ect2-RNAi or NT-RNAi were analyzed for anchorage-independent growth in soft agar (B) and cellular invasion through Matrigel-coated chambers (C). Ect2-RNAi (construct #3) and NT-RNAi cells were transfected with a plasmid expressing GFP-Ect2 (+Ect2) or a control empty plasmid and assessed for GFP-Ect2 and endogenous Ect2 expression by immunoblot analysis (D). Cells from (D) were assessed for anchorage-independent growth in soft agar (E) and invasion (F). Data in panels A-C, E and F are expressed as % NT control and represent the mean +/- SEM; n=3. * denotes a statistically significant difference from NT; ** denotes a statistically significant difference from Ect2 KD cells in the absence of GFP-Ect2, p<0.05)
Figure 4
Figure 4. Ect2 is required for NSCLC tumorigenicity in vivo
A549/NT and A549/Ect2 KD cells were injected subcutaneously into the flanks of nude mice and tumor volumes were determined over a four week period as described in Materials and Methods. (A) A549/Ect2 KD tumors grow significantly slower than A549/NT cell tumors. *indicates a statistically significant difference between A549/NT and A549/Ect2 KD tumor volumes at the indicated time points (p<0.05). (B) A549/NT and A549/Ect2 KD tumors stained with hematoxylin and eosin or Ect2 by immunohistochemistry. Ect2 expression is diminished in A549/Ect2 KD tumors. (C) BrdU staining of A549/NT and A549/Ect2 KD tumors (inset). BrdU-positive nuclei were counted as described in Materials and Methods. A549/Ect2 KD tumors exhibit a statistically significant decreased in BrdU labelling index when compared to A549/NT tumors (*p<0.05). (D) A549/NT and A549/Ect2 KD tumors exhibited no differences in TUNEL or CD31 staining.
Figure 5
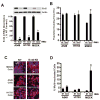
Figure 5. Ect2 KD does not induce cytokinesis defects in NSCLC cells
(A) RNAi-mediated knock down of Ect2 expression in A549, H1703 and MDCK cells. A549/Ect2 KD, A549/NT, H1703/Ect2 KD, H1703/NT, MDCK/Ect2 KD and MDCK/NT cells were analyzed for Ect2 mRNA and Ect2 protein. (B) Ect2 KD causes an increase in population doubling time in MDCK cells, but not A549 or H1703 cells. Population doubling times were determined as described in Materials and Methods. Results are expressed as mean doubling time in hours +/-SEM; n=3; *p<0.05. (C) Ect2 KD induces accumulation of multi-nucleated cells in MDCK but not A549 or H1703 cells. Cells were stained with phalloidin and DAPI and analyzed by confocal immunofluorescence microscopy as described in Materials and Methods. Arrows indicate multi-nucleated cells in MDCK/Ect2 KD cultures. (D) Quantitative analysis of multi-nucleated cells. At least 1,000 cells were counted from each cell line in each of three independent experiments. Data are expressed as % multi-nucleated cells +/- SEM. * indicates a statistically significant difference from MDCK/NT cells; p<0.02, n=3.
Figure 6
Figure 6. Rac1 is an effector of Ect2-mediated transformation in NSCLC cells
(A) Ect2 KD inhibits Rac1, but not Cdc42 or RhoA activity. Representative immunoblots of active and total Rac1, Cdc42 and RhoA in H1703 NT and Ect2 KD cells. (B) Quantitative analysis of Rac1, Cdc42 and RhoA activity in H1703 NT and Ect2 KD cells. Data are expressed as % NT control +/-SEM (*p<0.05, n=3). (C) Expression of constitutively active Rac1 (RacV12) in H1703/NT and H1703/Ect2 KD cells. (D) Reconstitution of anchorage independent soft agar growth in H1703/Ect2 KD cells by a RacV12 (*p<0.05, n=5). (E) Reconstitution of cellular invasion in H1703/Ect2 KD cells by RacV12 (*p<0.05, n=4). Data in D and E are expressed as % NT control +/-SEM.
Figure 7
Figure 7. Ect2 activates the Pak-Mek1,2-Erk1,2 signaling pathway in vivo
(A) Immunoblot analysis of A549/NT and A549/Ect2 KD tumors for Ect2, phospho-298-Mek1,2, total Mek1,2, phospho-Erk1,2, total Erk1,2, actin, and intact and cleaved PARP. Lysates from Hela cells treated with taxol for 48 hours were used a positive control for PARP cleavage. (B-D) Quantitative analysis demonstrates a statistically significant decrease in: (B) Ect2 protein expression (n=4/group; *p<0.0001), (C) phospho-298-Mek1,2/total Mek1,2 ratio (n=4/group; *p<0.004), and (D) phospho-Erk1,2/total Erk1,2 ratio (n=4/group; *p<0.03) (D) in A549/Ect2 KD tumors when compared to A549/NT tumors.
Figure 8
Figure 8. Ect2 associates with the PKCι-Par6α complex in NSCLC cells
(A) MDCK cells were stably transfected with wild-type human Flag-tagged Par6a (wtPar6) or control empty vector (Vector). Total cell lysates (Lysate) confirm expression of endogenous Ect2, PKCι and Flag-Par6α. Immunoprecipitation of PKCι co-precipitates Flag-Par6α and a small amount of endogenous Ect2 from MDCK/wtPar6 cells (PKCι IP). Immunoprecipitation of Flag-Par6α co-precipitates PKCι and a small amount of Ect2 from MDCK/wtPar6 cells (Flag IP). (B) H1703/pBabe (Vector) and H1703/wtPar6 (wtPar6) cells were subjected to immunoprecipitation analysis as described in (A). Endogenous Ect2 co-precipitates with both PKCι and Par6α in these cells. (C) H1703/PKCι KD cells were transfected with wtPKCι, a PKCι-D69A mutant or empty plasmid as described in Materials and Methods. Total cell lysates confirm expression of Ect2 and Flag-PKCι alleles (Lysates). Immunoprecipitation using Flag antibody co-precipitates Ect2 with wtPKCι but not PKCι-D63A (Flag IP). (D) H1703/Par6α KD cells were transfected with Flag-tagged wtPar6α, Par6α-K19A or empty control plasmid (Vector). Cell lysates confirm expression of Ect2, PKCι and Flag-Par6α alleles (Lysates). Immunoprecipitation using Flag antibody co-precipitates Ect2 and PKCι with wtPar6α but not Par6α-K19A.
Figure 9
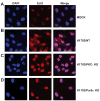
Figure 9. Ect2 is mis-localized to the cytoplasm of NSCLC cells
MDCK, H1703/NT, H1703/PKCι KD and H1703/Par6α KD cells were fixed, stained with DAPI and Ect2 antibody, and analyzed by confocal immunofluorescence microscopy as described in Materials and Methods. (A) Ect2 localizes almost exclusively to the nucleus of MDCK cells. (B) Ect2 localizes to both the nucleus and cytoplasm of H1703/NT cells. In contrast, Ect2 is largely localized to the nucleus of H1703/PKCι KD (C) and H1703/Par6αKD (D) cells.
Figure 10
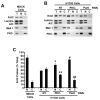
Figure 10. PKCι and Par6α regulate the cytoplasmic distribution of Ect2 in NSCLC cells
MDCK (A), H1703/NT, H1703/PKCι KD and H1703/Par6α KD (B) cells were fractionated into cytoplasmic and nuclear fractions. Total cell lysates, nuclear and cytoplasmic fractions from an equivalent cell number were subjected to immunoblot analysis for Ect2, PKCι, lamins A/C and Mek1. Lamins A/C served as a marker of nuclei and Mek1 as a marker of cytoplasm. (C) Quantitative analysis of nuclear and cytoplasmic Ect2 in MDCK, H1703/NT, H1703/PKCι KD and H1703/Par6α KD cells. Immunoblots from three independent fractionation experiments were analyzed by densitometry for Ect2. Results are plotted as % Total Ect2 in the nucleus (N) and cytoplasm (C). *, **, # and ## indicate a statistically significant difference in the amount of nuclear (* and #) and cytoplasmic (** and ##) Ect2 in the indicated cell line when compared to H1703/NT cells (*p<0.02), (**p<0.03), (#p<0.0005) and (##p<0.01); n=3.

Similar articles

Cited by

References

    1. Balsara BR, Sonoda G, du Manoir S, Siegfried JM, Gabrielson E, Testa JR. Comparative genomic hybridization analysis detects frequent, often high-level, overrepresentation of DNA sequences at 3q, 5p, 7p, and 8q in human non-small cell lung carcinomas. Cancer Res. 1997;57:2116–20. - PubMed
    1. Brass N, Ukena I, Remberger K, Mack U, Sybrecht GW, Meese EU. DNA amplification on chromosome 3q26.1-q26.3 in squamous cell carcinoma of the lung detected by reverse chromosome painting. Eur J Cancer. 1996;32A:1205–8. - PubMed
    1. Frederick LA, Matthews JA, Jamieson L, Justilien V, Thompson EA, Radisky DC, et al. Matrix metalloproteinase-10 is a critical effector of protein kinase Ciota-Par6alpha-mediated lung cancer. Oncogene 2008 - PMC - PubMed
    1. Hara T, Abe M, Inoue H, Yu LR, Veenstra TD, Kang YH, et al. Cytokinesis regulator ECT2 changes its conformation through phosphorylation at Thr-341 in G2/M phase. Oncogene. 2006;25:566–78. - PubMed
    1. Hirata D, Yamabuki T, Miki D, Ito T, Tsuchiya E, Fujita M, et al. Involvement of Epithelial Cell Transforming Sequence-2 Oncoantigen in Lung and Esophageal Cancer Progression. Clin Cancer Res. 2009;15:256–266. - PubMed

Publication types

MeSH terms