. 2009 Dec;19(12):2826-33.
doi: 10.1007/s00330-009-1512-5. Epub 2009 Jul 18.

Accelerating regional atrophy rates in the progression from normal aging to Alzheimer's disease

Affiliations

Accelerating regional atrophy rates in the progression from normal aging to Alzheimer's disease

Jasper D Sluimer et al. Eur Radiol. 2009 Dec.

Abstract

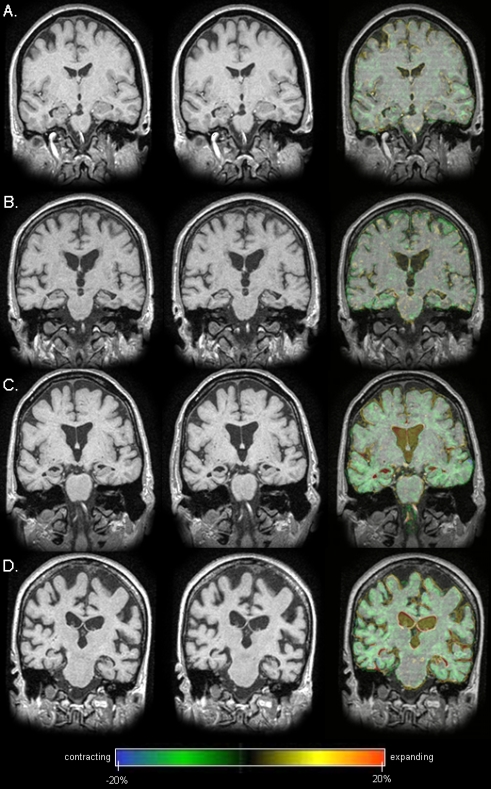
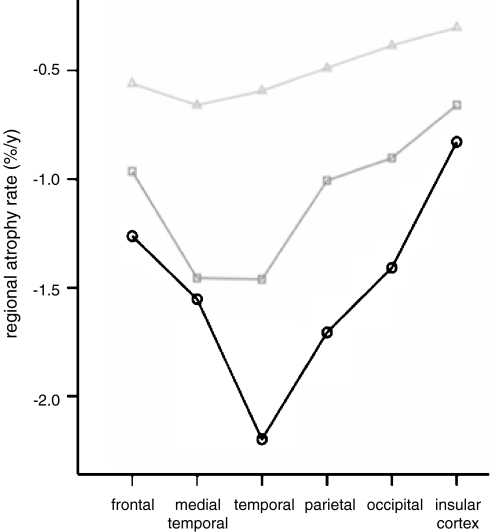
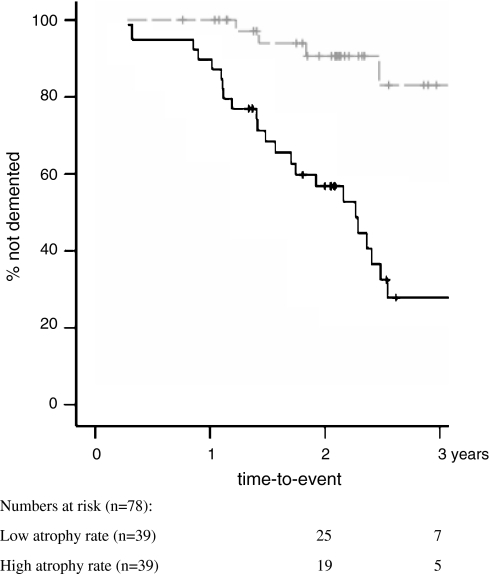
We investigated progression of atrophy in vivo, in Alzheimer's disease (AD), and mild cognitive impairment (MCI). We included 64 patients with AD, 44 with MCI and 34 controls with serial MRI examinations (interval 1.8 ± 0.7 years). A nonlinear registration algorithm (fluid) was used to calculate atrophy rates in six regions: frontal, medial temporal, temporal (extramedial), parietal, occipital lobes and insular cortex. In MCI, the highest atrophy rate was observed in the medial temporal lobe, comparable with AD. AD patients showed even higher atrophy rates in the extramedial temporal lobe. Additionally, atrophy rates in frontal, parietal and occipital lobes were increased. Cox proportional hazard models showed that all regional atrophy rates predicted conversion to AD. Hazard ratios varied between 2.6 (95% confidence interval (CI) = 1.1-6.2) for occipital atrophy and 15.8 (95% CI = 3.5-71.8) for medial temporal lobe atrophy. In conclusion, atrophy spreads through the brain with development of AD. MCI is marked by temporal lobe atrophy. In AD, atrophy rate in the extramedial temporal lobe was even higher. Moreover, atrophy rates also accelerated in parietal, frontal, insular and occipital lobes. Finally, in nondemented elderly, medial temporal lobe atrophy was most predictive of progression to AD, demonstrating the involvement of this region in the development of AD.


Figures

Fig. 1
Fig. 1
Baseline MR examination (left), repeat MR examination (middle) and colour overlay overlaid on the baseline examination (right) of four individual patients: a 50-year-old control subject, who presented at the memory clinic with subjective memory complaints (A); a 72-year-old MCI patient who remained stable during follow-up (B); a 69-year-old MCI patient who progressed to AD during follow-up (C); a 64-year-old, moderately demented AD patient (D). Baseline and repeat examinations were affine-registered. The result of the nonlinear registration is presented as a colour overlay applied to the baseline examination (representing the local Jacobian of the calculated deformation field), in order to highlight regions of structural expansion and contraction. Green and blue represent moderate to severe contraction (atrophy), yellow and red moderate to severe expansion. The overlay image was masked with a dilated mask to also show expansion of peripheral CSF spaces
Fig. 2
Fig. 2
Regional atrophy rate in six predefined lobar regions are presented by diagnostic group: frontal, medial temporal (hippocampus, amygdala, parahippocampal gyrus), temporal (extramedial), parietal, occipital and insular lobe. In controls, atrophy rates are around 0.5%/year for each region. In MCI patients, atrophy rates start to accelerate mainly in the medial temporal, and remaining temporal lobe (extramedial), and to a lesser extent in the other regions. AD is characterised by a further increase in atrophy rate in the remainder of the temporal lobe, parietal, frontal, occipital and insular lobe. Medial temporal lobe atrophy rates appear to be at a maximum, in the preclinical stage, since the rate is comparable to that of MCI patients. Δ = controls (light grey line); □ = MCI (dark grey line); ○ = AD (black line)
Fig. 3
Fig. 3
Kaplan–Meier curve of time-to-conversion in initially nondemented patients (n = 78) dependent on medial temporal lobe atrophy rate. Nondemented patients were dichotomised into either the high or the low category, based on median medial temporal lobe atrophy rate (−0.9%/year). Numbers at risk are displayed below graph. Participants reaching end of follow-up period without progression to dementia were censored. Low atrophy rate (dashed grey line); high atrophy rate of the medial temporal lobe (solid black line); + = censored

Similar articles

Cited by

References

    1. Petersen RC, Doody R, Kurz A, et al. Current concepts in mild cognitive impairment. Arch Neurol. 2001;58:1985–92. doi: 10.1001/archneur.58.12.1985. - DOI - PubMed
    1. Gauthier S, Reisberg B, Zaudig M, et al. Mild cognitive impairment. Lancet. 2006;367:1262–70. doi: 10.1016/S0140-6736(06)68542-5. - DOI - PubMed
    1. Braak H, Braak E. Neuropathological stageing of Alzheimer-related changes. Acta Neuropathol (Berl) 1991;82:239–59. doi: 10.1007/BF00308809. - DOI - PubMed
    1. Fox NC, Scahill RI, Crum WR, et al. Correlation between rates of brain atrophy and cognitive decline in AD. Neurology. 1999;52:1687–9. - PubMed
    1. Jack CR, Shiung MM, Weigand SD, et al. Brain atrophy rates predict subsequent clinical conversion in normal elderly and amnestic MCI. Neurology. 2005;65:1227–1231. doi: 10.1212/01.wnl.0000180958.22678.91. - DOI - PMC - PubMed