. 2009 Jul 20:9:241.
doi: 10.1186/1471-2407-9-241.

GLUT1 gene is a potential hypoxic marker in colorectal cancer patients

Affiliations

GLUT1 gene is a potential hypoxic marker in colorectal cancer patients

Fu-Yen Chung et al. BMC Cancer. .

Abstract

Background: Tumor hypoxia is an important factor related to tumor resistance to radiotherapy and chemotherapy. This study investigated molecules synthesized in colorectal cancer cells during hypoxia to explore the possibility of developing molecular probes capable of detecting cell death and/or the efficiency of radiotherapy and chemotherapy.

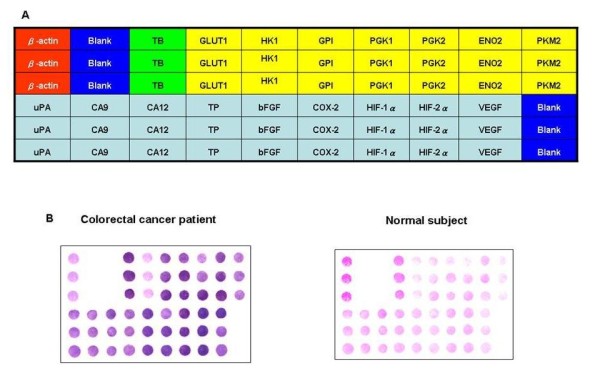
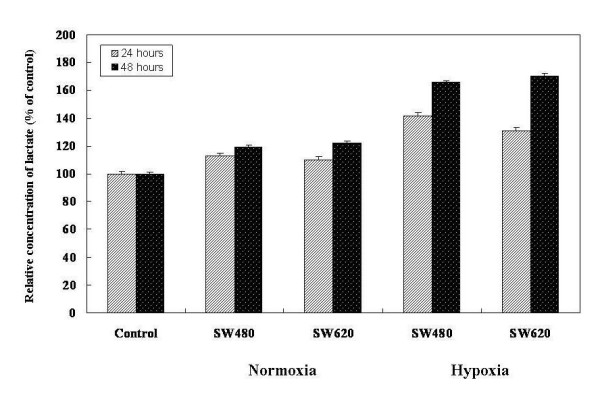
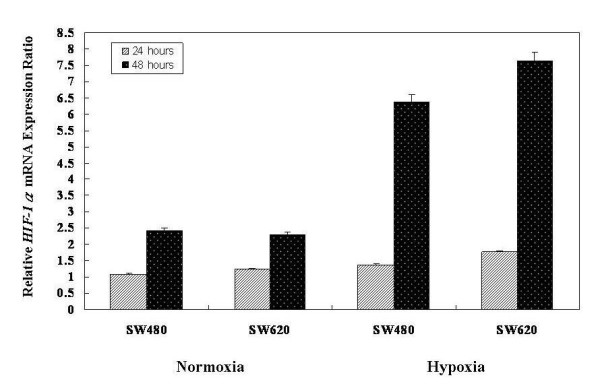
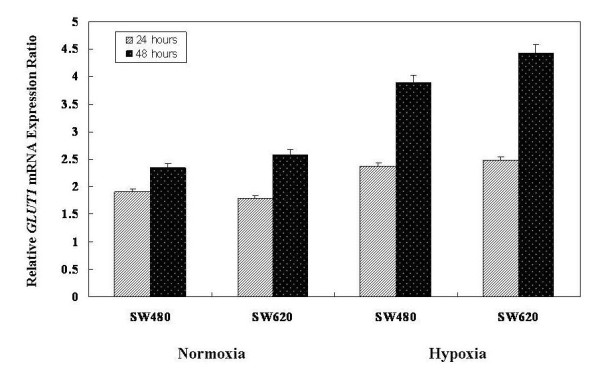
Methods: At first, we incubated two human colorectal adenocarcinoma cell lines SW480 (UICC stage II) and SW620 (UICC stage III) cells in hypoxic (< or =2% O2, 93% N2, and 5% CO2) and normoxic conditions (20% O2, 75% N2, and 5% CO2) for 24 h and 48 h. The relative expression ratio of GLUT1 mRNA in hypoxic conditions was analyzed by RT-PCR. Ten cancerous tissues collected from human colorectal cancer patients were examined. HIF-1alpha and HIF-2alpha levels were measured to indicate the degree of hypoxia, and gene expression under hypoxic conditions was determined. As a comparison, HIF-1alpha, HIF-2alpha, and GLUT1 levels were measured in the peripheral blood of 100 CRC patients.

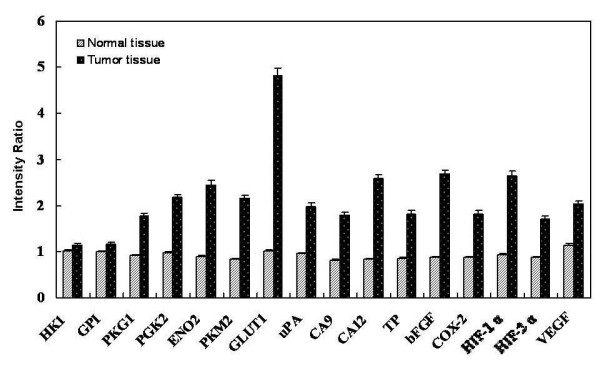
Results: Hypoxia-induced lactate was found to be elevated 3.24- to 3.36-fold in SW480 cells, and 3.06- to 3.17-fold in SW620 cells. The increased relative expression ratio of GLUT1 mRNA, under hypoxic conditions was higher in SW620 cells (1.39- to 1.72-fold elevation) than in SW480 cells (1.24- to 1.66-fold elevation). HIF-1alpha and HIF-2alpha levels were elevated and GLUT1 genes were significantly overexpressed in CRC tissue specimens. The elevated ratio of GLUT1 was higher in stage III and IV CRC tissue specimens than in the stage I and II (2.97-4.73 versus 1.44-2.11). GLUT1 mRNA was also increased in the peripheral blood of stage II and III CRC patients as compared to stage I patients, suggesting that GLUT1 may serve as a hypoxic indicator in CRC patients.

Conclusion: In conclusion, this study demonstrated that GLUT1 has the potential to be employed as a molecular marker to indicate the degree of hypoxia experienced by tumors circulating in the blood of cancer patients.


Figures

Figure 1
Figure 1
Schematic representation of membrane array and comparison of gene expression patterns between a human colorectal cancer patient (Case No. 6) and healthy control. (A) Schematic representation of membrane array with 16 target genes, one housekeeping gene (β-actin), one bacteria gene (TB), and blank control. Sixteen target genes (i.e., GLUT1, HK1, GPI, PGK1, PGK2, ENO2, PKM2, uPA, CA9, CA12, TP, bFGF, COX-2, HIF-1α, HIF-2α, and VEGF). The position of the correlation of the blank and positive control (β-actin) as well as the negative control (Mycobacterium tuberculosis; TB) in the nylon membrane are pointed out by spots. The relevant positions are the red area (β-actin), blue area (blank), green area (TB), yellow area (glycolysis-related genes), and pink area (hypoxia-related genes). (B) A triplicate set of 16 molecular markers for colorectal cancer was blotted on the nylon membrane. In addition, a housekeeping gene and a bacterial gene serving as positive and negative controls, respectively, were also blotted on the membrane.
Figure 2
Figure 2
Relative lactate concentration curves of two colorectal cancer cell lines. Supernatants from the two colorectal cancer cell lines SW480 and SW620. Control specimens were acquired from the supernatants of culture medium only. The concentrations of lactate were examined after incubation for 24 h and 48 h in hypoxia and normoxia conditions. Relative elevated lactate concentrations of SW480 cell lines were 3.24-fold (hypoxia/normoxia: 41.63/12.84; after 24 h incubation) and 3.36-fold (hypoxia/normoxia: 65.70/19.56; after 48 h incubation); however, there were 3.06-fold (hypoxia/normoxia: 30.78/10.05; after 24 h incubation) and 3.17-fold (hypoxia/normoxia: 70.45/22.23; after 48 h incubation) elevated lactate in SW620 cell lines. Values are means ± SD of 3 independent experiments with triplicate dishes.
Figure 3
Figure 3
RT-PCR analysis of HIF-1α and GLUT1 mRNA expression in SW480 and SW620 cell lines under normoxia and hypoxia conditions. Results of RT-PCR analysis of HIF-1α mRNA and GLUT1 mRNA expression in SW480 and SW620 cell lines incubated for approximately 24 and 48 h in hypoxia and normoxia conditions. The relative expression ratio of HIF-1α mRNA and GLUT1 mRNA under hypoxia conditions were all higher than normoxia in both cell lines. The mRNA levels of the housekeeping gene β-actin served as the internal control for the normalization of mRNA levels in experimental samples. The measured values in a series were normalized to the β-actin signal of the respective control.
Figure 4
Figure 4
Comparison of the relative HIF-1α mRNA expression ratio of SW480 and SW620 cell lines between normoxia and hypoxia conditions. The results showed that the relative HIF-1α mRNA expression levels were elevated in cells exposed to hypoxia conditions. The relative HIF-1α mRNA expression ratio of SW480 cell lines were 1.26-fold (hypoxia/normoxia: 1.36/1.08; after 24 h incubation) and 2.63-fold (hypoxia/normoxia: 6.37/2.42; after 48 h incubation); however, there was a 1.43-fold (hypoxia/normoxia: 1.76/1.23; after 24 h incubation) and 3.32-fold elevated HIF-1α mRNA expression (hypoxia/normoxia: 7.63/2.30; after 48 h incubation) in SW620 cell lines. The control groups were incubated in humidified atmospheric air without the addition of CO2. Values shown are means ± SD of 3 independent experiments with triplicate specimens.
Figure 5
Figure 5
Comparison of the relative GLUT1 mRNA expression levels of SW480 and SW620 cell lines between normoxia and hypoxia conditions. The results showed that the relative GLUT1 mRNA expression level was elevated in cells exposed to hypoxia. The relative GLUT1 mRNA expression ratio of SW480 cell lines were 1.24-fold (hypoxia/normoxia: 2.37/1.91; after 24 h incubation) and 1.66-fold (hypoxia/normoxia: 3.89/2.34; after 48 h incubation); however, there was a 1.39-fold (hypoxia/normoxia: 2.48/1.79; after 24 h incubation) and a 1.72-fold elevated GLUT1 mRNA expression (hypoxia/normoxia: 4.43/2.58; after 48 h incubation) in SW620 cell lines. The control groups were incubated in humidified atmospheric air without the addition of CO2. Values shown are means ± SD of 3 independent experiments with triplicate specimens.
Figure 6
Figure 6
Comparison of the hypoxia- and glycolysis-associated gene expression intensity between human CRC (Case No. 6) and normal tissue. The results showed the relative expression ratio of sixteen genes. The overexpression of GLUT1, HIF-1α, and HIF-2α are presented in these human colorectal cancer tissue samples.

References

    1. Coleman CN. Modulating the radiation response. Stem Cells. 1996;14(1):10–15. - PubMed
    1. Tredan O, Galmarini CM, Patel K, Tannock IF. Drug resistance and the solid tumor microenvironment. J Natl Cancer Inst. 2007;99(19):1441–1454. - PubMed
    1. Brizel DM, Scully SP, Harrelson JM, Layfield LJ, Bean JM, Prosnitz LR, Dewhirst MW. Tumor oxygenation predicts for the likelihood of distant metastases in human soft tissue sarcoma. Cancer Res. 1996;56(5):941–943. - PubMed
    1. Tatum JL, Kelloff GJ, Gillies RJ, Arbeit JM, Brown JM, Chao KS, Chapman JD, Eckelman WC, Fyles AW, Giaccia AJ. et al. Hypoxia: importance in tumor biology, noninvasive measurement by imaging, and value of its measurement in the management of cancer therapy. Int J Radiat Biol. 2006;82(10):699–757. - PubMed
    1. Birner P, Schindl M, Obermair A, Plank C, Breitenecker G, Oberhuber G. Overexpression of hypoxia-inducible factor 1alpha is a marker for an unfavorable prognosis in early-stage invasive cervical cancer. Cancer Res. 2000;60(17):4693–4696. - PubMed

Publication types

MeSH terms

Substances