An assessment of the portability of ancestry informative markers between human populations
- PMID: 19619313
- PMCID: PMC2719660
- DOI: 10.1186/1755-8794-2-45
An assessment of the portability of ancestry informative markers between human populations
Abstract
Background: Recent work has shown that population stratification can have confounding effects on genetic association studies and statistical methods have been developed to correct for these effects. Subsets of markers that are highly-differentiated between populations, ancestry-informative markers (AIMs), have been used to correct for population stratification. Often AIMs are discovered in one set of populations and then employed in a different set of populations. The underlying assumption in these cases is that the population under study has the same substructure as the population in which the AIMs were discovered. The present study assesses this assumption and evaluates the portability between worldwide populations of 10 SNPs found to be highly-differentiated within Britain (BritAIMs).
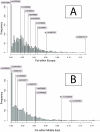
Methods: We genotyped 10 BritAIMs in approximately 1000 individuals from 53 populations worldwide. We assessed the degree to which these 10 BritAIMs capture population stratification in other groups of populations by use of the Fst statistic. We used Fst values from 2750 random markers typed in the same set of individuals as an empirical distribution to which the Fst values of the 10 BritAIMs were compared.
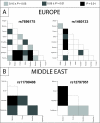
Results: Allele frequency differences between continental groups for the BritAIMs are not unusually high. This is also the case for comparisons within continental groups distantly related to Britain. However, two BritAIMs show high Fst between European populations and two BritAIMs show high Fst between populations from the Middle East. Overall the median Fst across all BritAIMs is not unusually high compared to the empirical distribution.
Conclusion: We find that BritAIMs are generally not useful to distinguish between continental groups or within continental groups distantly related to Britain. Moreover, our analyses suggest that the portability of AIMs across geographical scales (e.g. between Europe and Britain) can be limited and should therefore be taken into consideration in the design and interpretation of genetic association studies.
Figures


Similar articles
-
Worldwide population differentiation at disease-associated SNPs.BMC Med Genomics. 2008 Jun 4;1:22. doi: 10.1186/1755-8794-1-22. BMC Med Genomics. 2008. PMID: 18533027 Free PMC article.
-
Evaluating a subset of ancestry informative SNPs for discriminating among Southwest Asian and circum-Mediterranean populations.Forensic Sci Int Genet. 2016 Jul;23:153-158. doi: 10.1016/j.fsigen.2016.04.010. Epub 2016 Apr 27. Forensic Sci Int Genet. 2016. PMID: 27160361
-
Global analysis of population stratification using a smart panel of 27 continental ancestry-informative SNPs.Forensic Sci Int Genet. 2018 Jul;35:e10-e12. doi: 10.1016/j.fsigen.2018.05.006. Epub 2018 May 18. Forensic Sci Int Genet. 2018. PMID: 29803513
-
Accounting for ancestry: population substructure and genome-wide association studies.Hum Mol Genet. 2008 Oct 15;17(R2):R143-50. doi: 10.1093/hmg/ddn268. Hum Mol Genet. 2008. PMID: 18852203 Free PMC article. Review.
-
Using ancestry-informative markers to define populations and detect population stratification.J Psychopharmacol. 2006 Jul;20(4 Suppl):19-26. doi: 10.1177/1359786806066041. J Psychopharmacol. 2006. PMID: 16785266 Review.
Cited by
-
Integrative analysis of single nucleotide polymorphisms and gene expression efficiently distinguishes samples from closely related ethnic populations.BMC Genomics. 2012 Jul 28;13:346. doi: 10.1186/1471-2164-13-346. BMC Genomics. 2012. PMID: 22839760 Free PMC article.
-
Genetic ancestry plays a central role in population pharmacogenomics.Commun Biol. 2021 Feb 5;4(1):171. doi: 10.1038/s42003-021-01681-6. Commun Biol. 2021. PMID: 33547344 Free PMC article.
-
Application of genetic/genomic approaches to allergic disorders.J Allergy Clin Immunol. 2010 Sep;126(3):425-36; quiz 437-8. doi: 10.1016/j.jaci.2010.05.025. Epub 2010 Jul 16. J Allergy Clin Immunol. 2010. PMID: 20638111 Free PMC article. Review.
-
A panel of 130 autosomal single-nucleotide polymorphisms for ancestry assignment in five Asian populations and in Caucasians.Forensic Sci Med Pathol. 2017 Jun;13(2):177-187. doi: 10.1007/s12024-017-9863-8. Epub 2017 Apr 24. Forensic Sci Med Pathol. 2017. PMID: 28439786
References
-
- Bunker CH, Patrick AL, Konety BR, Dhir R, Brufsky AM, Vivas CA, Becich MJ, Trump DL, Kuller LH. High prevalence of screening-detected prostate cancer among Afro-Caribbeans: the Tobago Prostate Cancer Survey. Cancer Epidemiol Biomarkers Prev. 2002;11:726–729. - PubMed
Grants and funding
LinkOut - more resources
Full Text Sources
Other Literature Sources
Miscellaneous

