

Water replacement hypothesis in atomic detail--factors determining the structure of dehydrated bilayer stacks
- PMID: 19619463
- PMCID: PMC2711319
- DOI: 10.1016/j.bpj.2009.05.007
Water replacement hypothesis in atomic detail--factors determining the structure of dehydrated bilayer stacks
Abstract
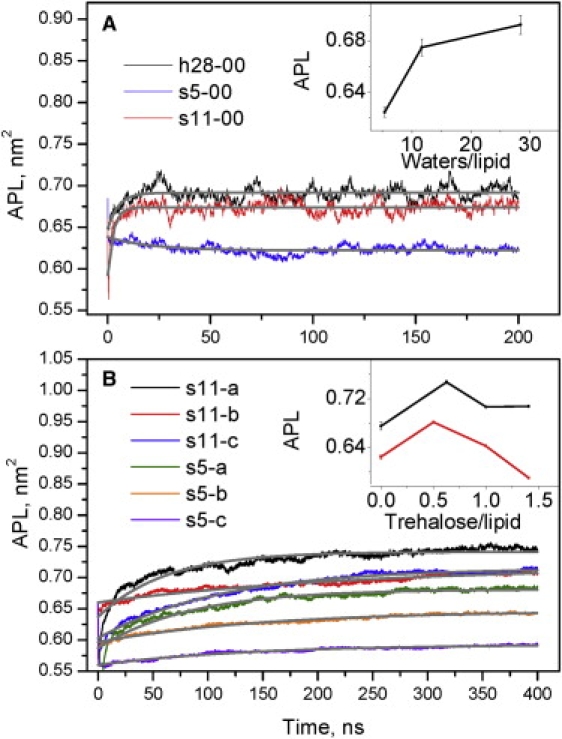
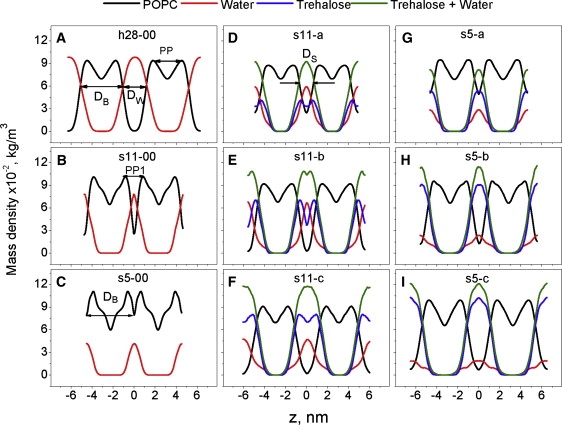
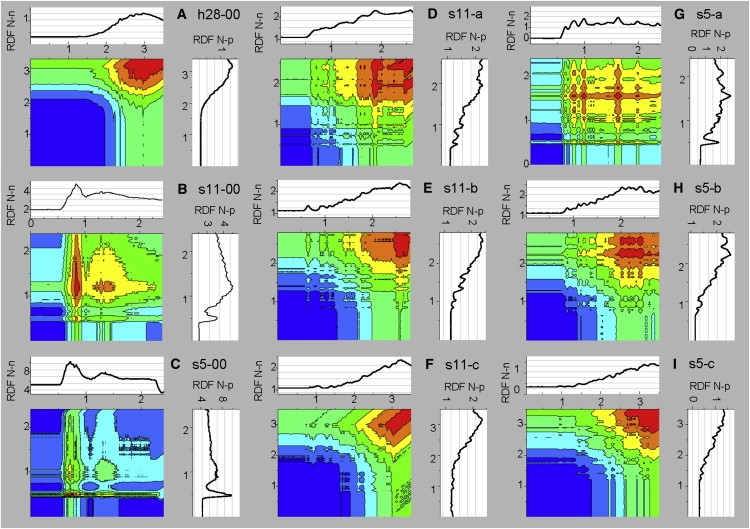
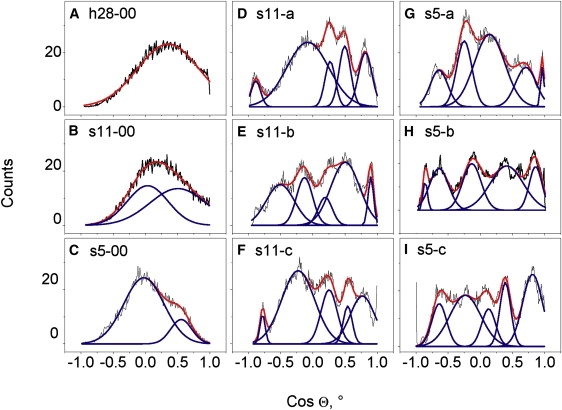
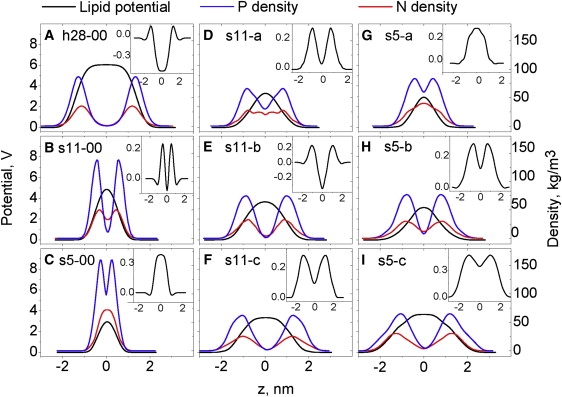
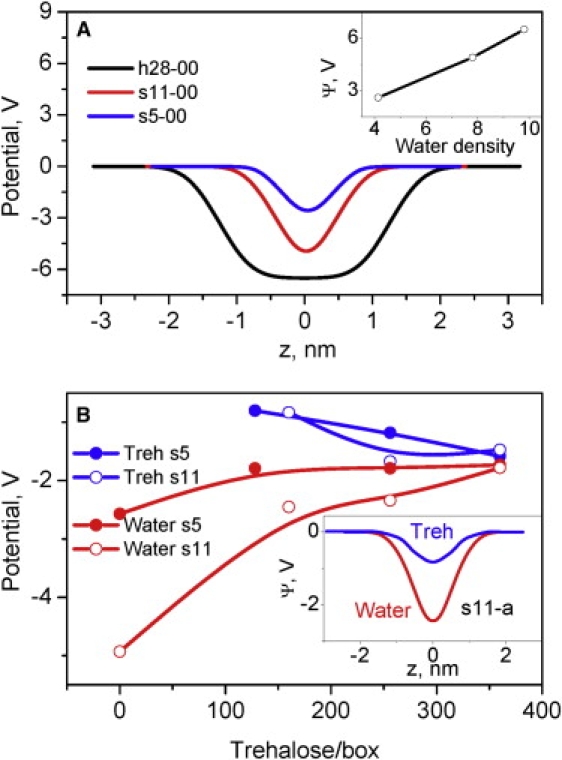
According to the water replacement hypothesis, trehalose stabilizes dry membranes by preventing the decrease of spacing between membrane lipids under dehydration. In this study, we use molecular-dynamics simulations to investigate the influence of trehalose on the area per lipid (APL) and related structural properties of dehydrated bilayers in atomic detail. The starting conformation of a palmitoyloleolylphosphatidylcholine lipid bilayer in excess water was been obtained by self-assembly. A series of molecular-dynamics simulations of palmitoyloleolylphosphatidylcholine with different degrees of dehydration (28.5, 11.7, and 5.4 waters per lipid) and different molar trehalose/lipid ratios (<1:1, 1:1, and >1:1) were carried out in the NPT ensemble. Water removal causes the formation of multilamellar "stacks" through periodic boundary conditions. The headgroups reorient from pointing outward to inward with dehydration. This causes changes in the electrostatic interactions between interfaces, resulting in interface interpenetration. Interpenetration creates self-spacing of the bilayers and prevents gel-phase formation. At lower concentrations, trehalose does not separate the interfaces, and acting together with self-spacing, it causes a considerable increase of APL. APL decreases at higher trehalose concentrations when the layer of sugar physically separates the interfaces. When interfaces are separated, the model confirms the water replacement hypothesis.
Figures
References
-
- Tanford C. Hydrophobic effect and organization of living matter. Science. 1978;200:1012–1018. - PubMed
-
- Alpert P., Oliver M.J. Drying without dying. In: Black M., Pritchard H.W., editors. Desiccation and Survival in Plants: Drying Without Dying. CAB International/Wallingford; Oxon, UK: 2002. pp. 3–43.
-
- Crowe J.H., Crowe L.M., Chapman D. Preservation of membranes in anhydrobiotic organisms. Science. 1984;223:701–703. - PubMed
-
- Crowe J.H., Hoekstra F.A., Crowe L.M. Anhydrobiosis. Annu. Rev. Physiol. 1992;54:579–599. - PubMed
-
- Crowe J.H., Carpenter J.F., Crowe L.M. The role of vitrification in anhydrobiosis. Annu. Rev. Physiol. 1998;60:73–103. - PubMed
Publication types
MeSH terms
Substances
LinkOut - more resources
Full Text Sources
