

Human microtubule-associated-protein tau regulates the number of protofilaments in microtubules: a synchrotron x-ray scattering study
- PMID: 19619466
- PMCID: PMC2711315
- DOI: 10.1016/j.bpj.2009.04.047
Human microtubule-associated-protein tau regulates the number of protofilaments in microtubules: a synchrotron x-ray scattering study
Abstract
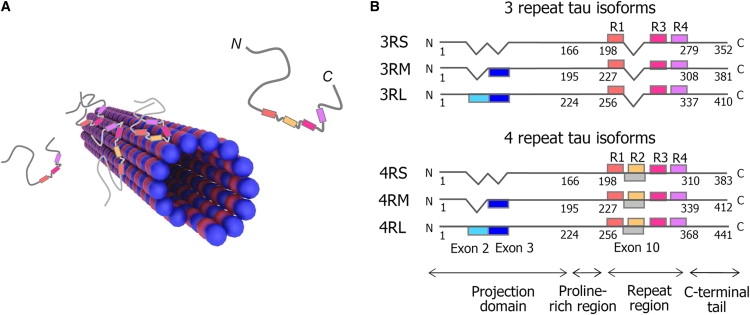
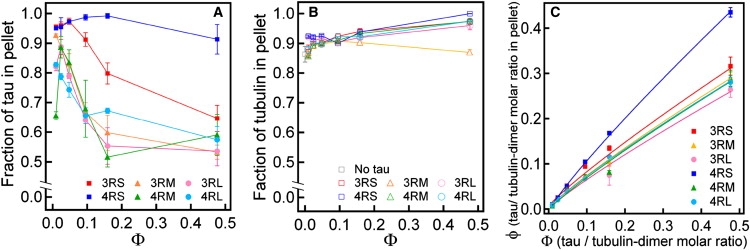
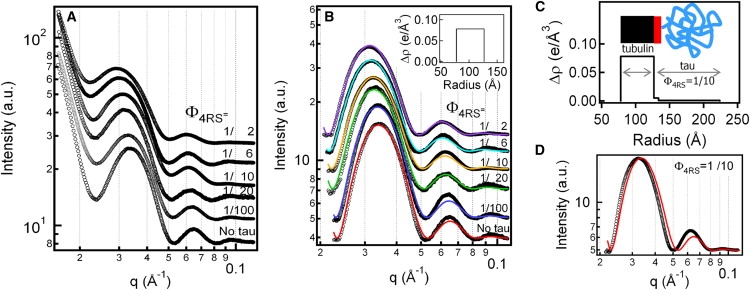
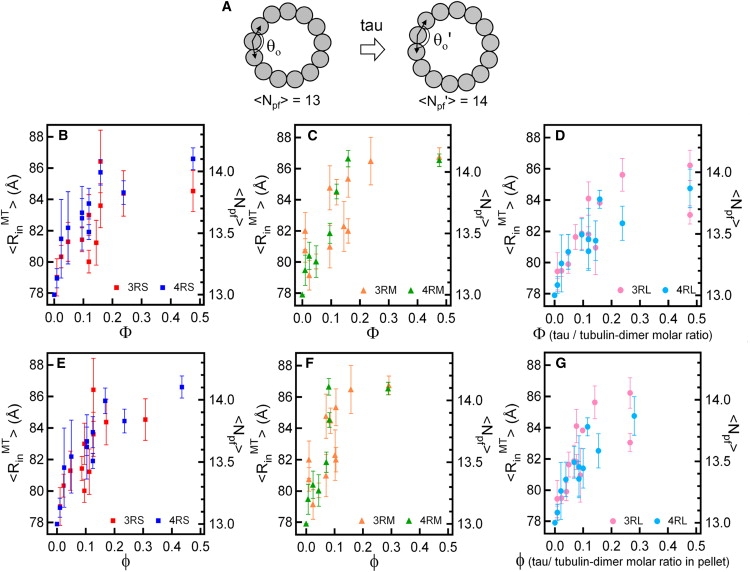
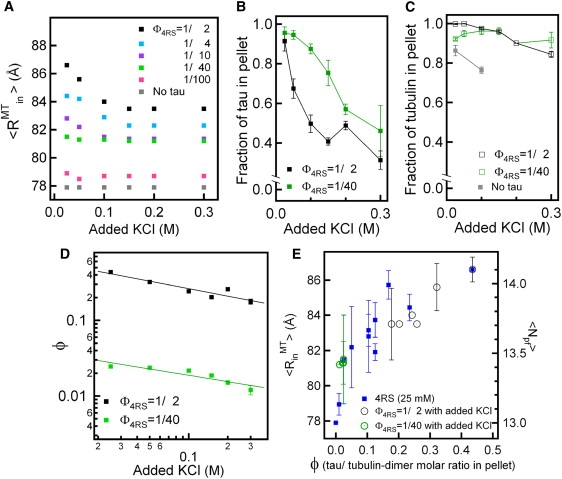
Microtubules (MTs), a major component of the eukaryotic cytoskeleton, are 25 nm protein nanotubes with walls comprised of assembled protofilaments built from alphabeta heterodimeric tubulin. In neural cells, different isoforms of the microtubule-associated-protein (MAP) tau regulate tubulin assembly and MT stability. Using synchrotron small angle x-ray scattering (SAXS), we have examined the effects of all six naturally occurring central nervous system tau isoforms on the assembly structure of taxol-stabilized MTs. Most notably, we found that tau regulates the distribution of protofilament numbers in MTs as reflected in the observed increase in the average radius R(MT) of MTs with increasing Phi, the tau/tubulin-dimer molar ratio. Within experimental scatter, the change in R(MT) seems to be isoform independent. Significantly, R(MT) was observed to rapidly increase for 0 < Phi < 0.2 and saturate for Phi between 0.2-0.5. Thus, a local shape distortion of the tubulin dimer on tau binding, at coverages much less than a monolayer, is spread collectively over many dimers on the scale of protofilaments. This implies that tau regulates the shape of protofilaments and thus the spontaneous curvature C(o)(MT) of MTs leading to changes in the curvature C(MT) (=1/R(MT)). An important biological implication of these findings is a possible allosteric role for tau where the tau-induced shape changes of the MT surface may effect the MT binding activity of other MAPs present in neurons. Furthermore, the results, which provide insight into the regulation of the elastic properties of MTs by tau, may also impact biomaterials applications requiring radial size-controlled nanotubes.
Figures
Similar articles
-
Direct force measurements reveal that protein Tau confers short-range attractions and isoform-dependent steric stabilization to microtubules.Proc Natl Acad Sci U S A. 2015 Nov 24;112(47):E6416-25. doi: 10.1073/pnas.1513172112. Epub 2015 Nov 5. Proc Natl Acad Sci U S A. 2015. PMID: 26542680 Free PMC article.
-
Paclitaxel suppresses Tau-mediated microtubule bundling in a concentration-dependent manner.Biochim Biophys Acta Gen Subj. 2017 Jan;1861(1 Pt A):3456-3463. doi: 10.1016/j.bbagen.2016.09.011. Epub 2016 Sep 12. Biochim Biophys Acta Gen Subj. 2017. PMID: 27632200
-
The effect of multivalent cations and Tau on paclitaxel-stabilized microtubule assembly, disassembly, and structure.Adv Colloid Interface Sci. 2016 Jun;232:9-16. doi: 10.1016/j.cis.2015.11.002. Epub 2015 Nov 11. Adv Colloid Interface Sci. 2016. PMID: 26684364 Free PMC article. Review.
-
Radial compression of microtubules and the mechanism of action of taxol and associated proteins.Biophys J. 2005 Nov;89(5):3410-23. doi: 10.1529/biophysj.104.057679. Epub 2005 Aug 12. Biophys J. 2005. PMID: 16100275 Free PMC article.
-
Minireview - Microtubules and Tubulin Oligomers: Shape Transitions and Assembly by Intrinsically Disordered Protein Tau and Cationic Biomolecules.Langmuir. 2019 Dec 3;35(48):15970-15978. doi: 10.1021/acs.langmuir.9b02208. Epub 2019 Oct 2. Langmuir. 2019. PMID: 31539262 Free PMC article. Review.
Cited by
-
Tau antagonizes end-binding protein tracking at microtubule ends through a phosphorylation-dependent mechanism.Mol Biol Cell. 2016 Oct 1;27(19):2924-34. doi: 10.1091/mbc.E16-01-0029. Epub 2016 Jul 27. Mol Biol Cell. 2016. PMID: 27466319 Free PMC article.
-
Dynamic behaviors of α-synuclein and tau in the cellular context: New mechanistic insights and therapeutic opportunities in neurodegeneration.Neurobiol Dis. 2019 Dec;132:104543. doi: 10.1016/j.nbd.2019.104543. Epub 2019 Jul 24. Neurobiol Dis. 2019. PMID: 31351173 Free PMC article. Review.
-
Alpha-synuclein facilitates to form short unconventional microtubules that have a unique function in the axonal transport.Sci Rep. 2017 Nov 27;7(1):16386. doi: 10.1038/s41598-017-15575-3. Sci Rep. 2017. PMID: 29180624 Free PMC article.
-
Crosstalk between copper, Alzheimer's disease, and melatonin.Biometals. 2025 Jul 12. doi: 10.1007/s10534-025-00712-7. Online ahead of print. Biometals. 2025. PMID: 40650773 Review.
-
Nanoscale assembly in biological systems: from neuronal cytoskeletal proteins to curvature stabilizing lipids.Adv Mater. 2011 May 24;23(20):2260-70. doi: 10.1002/adma.201004647. Epub 2011 Apr 20. Adv Mater. 2011. PMID: 21506171 Free PMC article. Review.
References
-
- Desai A., Mitchinson T.J. Microtubule polymerization dynamics. Annu. Rev. Cell Dev. Biol. 1997;13:83–117. - PubMed
-
- Andreu J.M., Bordas J., Diaz J.F., Garcia de Ancos J., Gil R. Low resolution structure of microtubules in solution: synchrotron x-ray scattering and electron microscopy of Taxol-induced microtubule assembled from purified tubulin in comparison with glycerol and MAP-induced microtubules. J. Mol. Biol. 1992;226:169–184. - PubMed
-
- Andreu J.M., Diaz J.F., Gil R., de Preda J.M., de Lacoba M.G. Solution structure of Taxotere-induced microtubules to 3-nm resolution. J. Biol. Chem. 1994;269:31785–31792. - PubMed
Publication types
MeSH terms
Substances
Grants and funding
LinkOut - more resources
Full Text Sources
Other Literature Sources
Miscellaneous
