

Random walk simulation of the MRI apparent diffusion coefficient in a geometrical model of the acinar tree
- PMID: 19619480
- PMCID: PMC2711347
- DOI: 10.1016/j.bpj.2009.04.050
Random walk simulation of the MRI apparent diffusion coefficient in a geometrical model of the acinar tree
Abstract
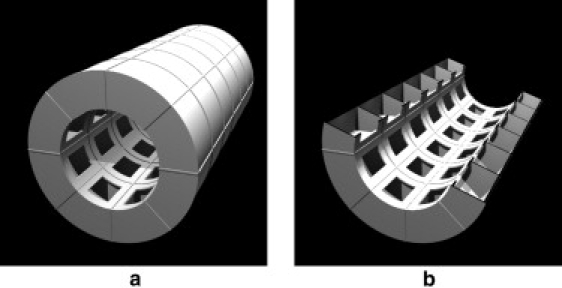
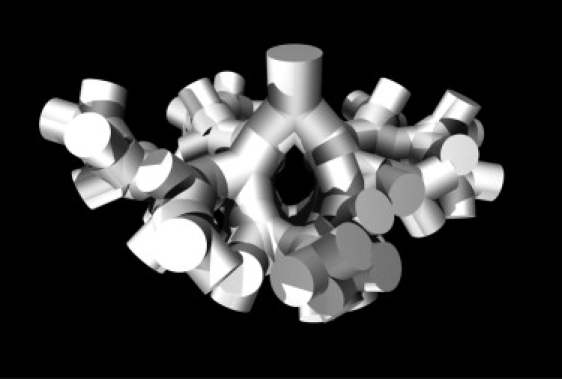
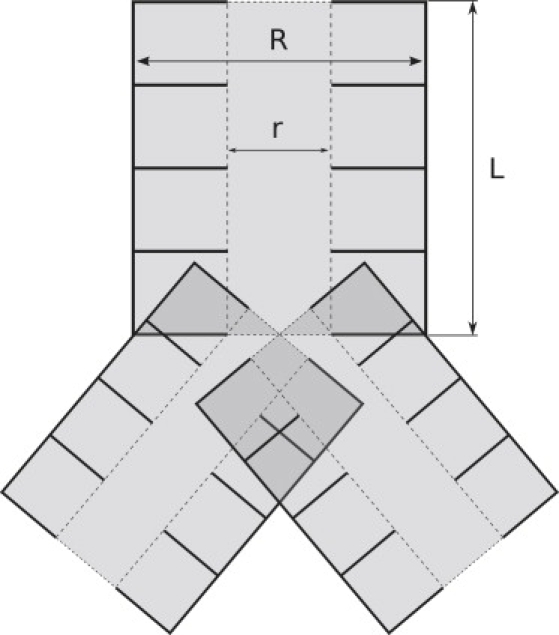
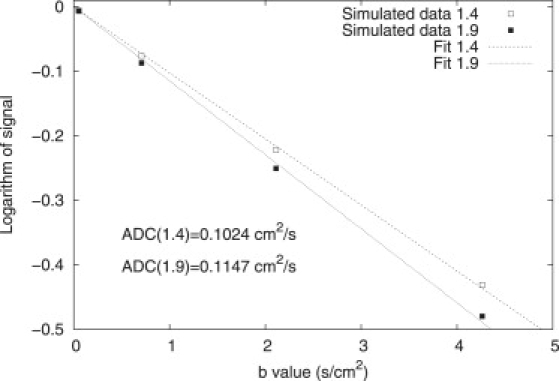
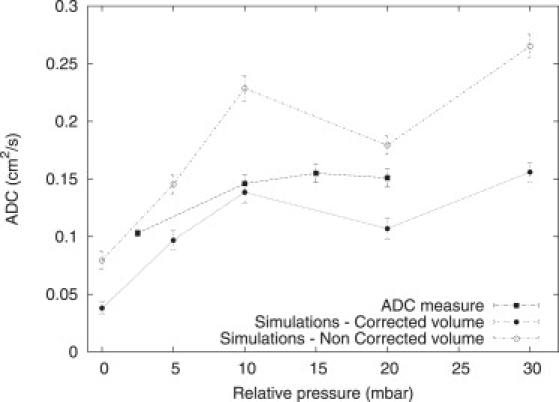
Apparent diffusion coefficient (ADC) measurement in the lung using gas magnetic resonance imaging is a promising technique with potential for reflecting changes in lung microstructure. Despite some recent impressive human applications, full interpretation of ADC measures remains an elusive goal, due to a lack of detailed knowledge about the structure dependency of ADC. In an attempt to fill this gap we have performed random walk simulations in a three-dimensional geometrical model of the lung acinus, the distal alveolated sections of the lung tree accounting for approximately 90% of the total lung volume. Simulations were carried out adjusting model parameters after published morphological data for the rat peripheral airway system, which predict an ADC behavior as microstructure changes with lung inflation in partial agreement with measured ADCs at different airway pressures. The approach used to relate experimental ADCs to lung microstructural changes does not make any assumption about the cause of the changes, so it could be applied to other scenarios such as chronic obstructive pulmonary disease, lung development, etc. The work presented here predicts numerically for the first time ADC values measured in the lung from independent morphological measures of lung microstructure taken at different inflation stages during the breath cycle.
Figures
Similar articles
-
Acinar determinants of the apparent diffusion coefficient for helium-3.J Appl Physiol (1985). 2010 Apr;108(4):793-9. doi: 10.1152/japplphysiol.01230.2009. Epub 2010 Feb 18. J Appl Physiol (1985). 2010. PMID: 20167670
-
Modeling Airflow and Particle Deposition in a Human Acinar Region.Comput Math Methods Med. 2019 Jan 14;2019:5952941. doi: 10.1155/2019/5952941. eCollection 2019. Comput Math Methods Med. 2019. PMID: 30755779 Free PMC article.
-
Hyperpolarized gas diffusion MRI of biphasic lung inflation in short- and long-term emphysema models.Am J Physiol Lung Cell Mol Physiol. 2017 Aug 1;313(2):L305-L312. doi: 10.1152/ajplung.00048.2017. Epub 2017 May 4. Am J Physiol Lung Cell Mol Physiol. 2017. PMID: 28473321 Free PMC article.
-
Simulations of short-time diffusivity in lung airspaces and implications for S/V measurements using hyperpolarized-gas MRI.IEEE Trans Med Imaging. 2007 Nov;26(11):1456-63. doi: 10.1109/TMI.2007.903192. IEEE Trans Med Imaging. 2007. PMID: 18041261
-
Simulation of the apparent diffusion of helium-3 in the human acinus.J Appl Physiol (1985). 2007 Jul;103(1):249-54. doi: 10.1152/japplphysiol.01384.2006. Epub 2007 Mar 22. J Appl Physiol (1985). 2007. PMID: 17379747
Cited by
-
In vivo methods and applications of xenon-129 magnetic resonance.Prog Nucl Magn Reson Spectrosc. 2021 Feb;122:42-62. doi: 10.1016/j.pnmrs.2020.11.002. Epub 2020 Dec 9. Prog Nucl Magn Reson Spectrosc. 2021. PMID: 33632417 Free PMC article. Review.
-
Diffusion lung imaging with hyperpolarized gas MRI.NMR Biomed. 2017 Mar;30(3):10.1002/nbm.3448. doi: 10.1002/nbm.3448. Epub 2015 Dec 16. NMR Biomed. 2017. PMID: 26676342 Free PMC article. Review.
-
Probing lung microstructure with hyperpolarized noble gas diffusion MRI: theoretical models and experimental results.Magn Reson Med. 2014 Feb;71(2):486-505. doi: 10.1002/mrm.24729. Magn Reson Med. 2014. PMID: 23554008 Free PMC article.
References
-
- Albert M.S., Cates G.D., Driehuys B., Happer W., Springer C.S. Biological magnetic resonance imaging using laser polarized 129Xe. Nature. 1994;370:199–201. - PubMed
-
- Saam B.T., Yablonskiy D.A., Kodibagkar V.D., Leawoods J.C., Gierada D.S. MR imaging of diffusion of 3He gas in healthy and diseased lungs. Magn. Reson. Med. 2000;44:174–179. - PubMed
-
- Mayo J.R., Hayden M.E. Hyperpolarized helium-3 diffusion imaging of the lung. Radiology. 2002;222:8–11. - PubMed
-
- Möller H.E., Chen X.J., Saam B., Hagspiel K.D., Johnson G.A. MRI of the lungs using hyperpolarized noble gases. Magn. Reson. Med. 2002;47:1029–1051. - PubMed
-
- Kauczor H.U. Hyperpolarized helium-3 gas magnetic resonance imaging of the lung. Top. Magn. Reson. Imaging. 2003;14:223–230. - PubMed
Publication types
MeSH terms
LinkOut - more resources
Full Text Sources
Medical
Miscellaneous
