

Imaging barriers to diffusion by pair correlation functions
- PMID: 19619481
- PMCID: PMC2711318
- DOI: 10.1016/j.bpj.2009.04.048
Imaging barriers to diffusion by pair correlation functions
Abstract
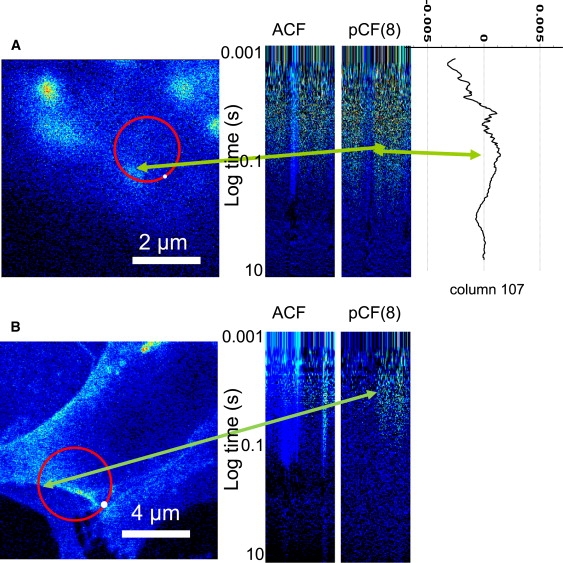
Molecular diffusion and transport are fundamental processes in physical, chemical, biochemical, and biological systems. However, current approaches to measure molecular transport in cells and tissues based on perturbation methods such as fluorescence recovery after photobleaching are invasive, fluctuation correlation methods are local, and single-particle tracking requires the observation of isolated particles for relatively long periods of time. We propose to detect molecular transport by measuring the time cross-correlation of fluctuations at a pair of locations in the sample. When the points are farther apart than two times the size of the point spread function, the maximum of the correlation is proportional to the average time a molecule takes to move from a specific location to another. We demonstrate the method by simulations, using beads in solution, and by measuring the diffusion of molecules in cellular membranes. The spatial pair cross-correlation method detects barriers to diffusion and heterogeneity of diffusion because the time of the correlation maximum is delayed in the presence of diffusion barriers. This noninvasive, sensitive technique follows the same molecule over a large area, thereby producing a map of molecular flow. It does not require isolated molecules, and thus many molecules can be labeled at the same time and within the point spread function.
Figures


Similar articles
-
Lessons in fluctuation correlation spectroscopy.Annu Rev Phys Chem. 2011;62:645-68. doi: 10.1146/annurev-physchem-032210-103424. Annu Rev Phys Chem. 2011. PMID: 21219151 Free PMC article. Review.
-
In vivo imaging of single-molecule translocation through nuclear pore complexes by pair correlation functions.PLoS One. 2010 May 3;5(5):e10475. doi: 10.1371/journal.pone.0010475. PLoS One. 2010. PMID: 20454622 Free PMC article.
-
Meaningful interpretation of subdiffusive measurements in living cells (crowded environment) by fluorescence fluctuation microscopy.Curr Pharm Biotechnol. 2010 Aug;11(5):527-43. doi: 10.2174/138920110791591454. Curr Pharm Biotechnol. 2010. PMID: 20553227 Free PMC article.
-
In vivo pair correlation analysis of EGFP intranuclear diffusion reveals DNA-dependent molecular flow.Proc Natl Acad Sci U S A. 2010 Sep 21;107(38):16560-5. doi: 10.1073/pnas.1006731107. Epub 2010 Sep 7. Proc Natl Acad Sci U S A. 2010. PMID: 20823232 Free PMC article.
-
Single-molecule fluorescence microscopy to determine phospholipid lateral diffusion.Methods Mol Biol. 2007;400:277-94. doi: 10.1007/978-1-59745-519-0_19. Methods Mol Biol. 2007. PMID: 17951741 Review.
Cited by
-
Pre-corneal tear film thickness in humans measured with a novel technique.Mol Vis. 2011 Mar 22;17:756-67. Mol Vis. 2011. PMID: 21527997 Free PMC article.
-
Measuring the flow of molecules in cells.Biophys Rev. 2011 Sep;3(3):119. doi: 10.1007/s12551-011-0051-x. Epub 2011 Jul 19. Biophys Rev. 2011. PMID: 28510061 Free PMC article. Review.
-
Tracking the mechanical dynamics of human embryonic stem cell chromatin.Epigenetics Chromatin. 2012 Dec 21;5(1):20. doi: 10.1186/1756-8935-5-20. Epigenetics Chromatin. 2012. PMID: 23259580 Free PMC article.
-
Transbilayer Coupling of Lipids in Cells Investigated by Imaging Fluorescence Correlation Spectroscopy.J Phys Chem B. 2022 Mar 31;126(12):2325-2336. doi: 10.1021/acs.jpcb.2c00117. Epub 2022 Mar 16. J Phys Chem B. 2022. PMID: 35294838 Free PMC article.
-
Radial pair correlation of molecular brightness fluctuations maps protein diffusion as a function of oligomeric state within live-cell nuclear architecture.Biophys J. 2022 Jun 7;121(11):2152-2167. doi: 10.1016/j.bpj.2022.04.030. Epub 2022 Apr 30. Biophys J. 2022. PMID: 35490296 Free PMC article.
References
-
- Dertinger T., Loman A., Ewers B., Muller C.B., Kramer B. The optics and performance of dual-focus fluorescence correlation spectroscopy. Opt. Express. 2008;16:14353–14368. - PubMed
-
- Brown D.A., London E. Structure and origin of ordered lipid domains in biological membranes. J. Membr. Biol. 1998;164:103–114. - PubMed
-
- Sheets E.D., Simson R., Jacobson K. New insights into membrane dynamics from the analysis of cell surface interactions by physical methods. Curr. Opin. Cell Biol. 1995;7:707–714. - PubMed
Publication types
MeSH terms
Substances
Grants and funding
LinkOut - more resources
Full Text Sources
Other Literature Sources
